Decoding the Stock Hammer Candle: A Comprehensive Guide for Traders
In the dynamic world of stock trading, recognizing patterns is crucial for making informed decisions. Among the many candlestick patterns, the stock hammer candle stands out as a potential signal of a bullish reversal. This guide provides a comprehensive overview of the stock hammer candle, its characteristics, how to identify it, and how to use it effectively in your trading strategy.
What is a Stock Hammer Candle?
The stock hammer candle is a single candlestick pattern that occurs after a downtrend and signals a potential reversal to the upside. It’s characterized by a small body, a long lower shadow (or wick), and little or no upper shadow. The long lower shadow indicates that sellers initially pushed the price lower, but buyers then stepped in and drove the price back up, suggesting a shift in momentum.
Key Characteristics of a Stock Hammer Candle:
- Small Body: The real body (the difference between the open and close price) is small. This indicates that the price didn’t move significantly between the open and close.
- Long Lower Shadow: The lower shadow is at least twice the length of the body. This signifies that the price traded much lower during the period but recovered to close near the open.
- Little or No Upper Shadow: Ideally, there should be little or no upper shadow. This strengthens the bullish signal.
- Occurs After a Downtrend: The stock hammer candle is only valid as a bullish reversal signal if it forms after a period of declining prices.
Identifying a Stock Hammer Candle on a Chart
Identifying a stock hammer candle is relatively straightforward. Look for these key elements:
- Existing Downtrend: Ensure that the price has been trending downwards for a period of time. This is a crucial prerequisite.
- Candlestick Shape: Scan the chart for candlesticks with a small body and a long lower shadow that is at least twice the length of the body.
- Confirmation: Look for confirmation in the subsequent candlesticks. A bullish confirmation would be a candlestick that closes above the high of the stock hammer candle.
The Psychology Behind the Stock Hammer Candle
Understanding the psychology behind the stock hammer candle can help you interpret its significance. During the trading period, sellers were initially in control, pushing the price down to new lows. However, buyers then entered the market, aggressively buying up the stock and driving the price back towards the opening level. This suggests that buyers are gaining strength and that the downtrend may be losing momentum. The long lower shadow represents a rejection of lower prices and a potential shift in sentiment.
Using the Stock Hammer Candle in Your Trading Strategy
While the stock hammer candle can be a valuable tool, it’s important to use it in conjunction with other indicators and analysis techniques. Here are some ways to incorporate it into your trading strategy:
Confirmation is Key
Never trade solely based on the appearance of a stock hammer candle. Always wait for confirmation from the next candlestick. A bullish confirmation would be a candlestick that closes above the high of the hammer. This confirms that the buying pressure is sustained and that the reversal is likely to continue.
Combine with Other Indicators
Use other technical indicators, such as moving averages, RSI (Relative Strength Index), and MACD (Moving Average Convergence Divergence), to confirm the bullish signal. For example, if the stock hammer candle forms near a key support level and the RSI is oversold, this strengthens the likelihood of a reversal. [See also: Understanding Support and Resistance Levels]
Volume Analysis
Pay attention to the volume during the formation of the stock hammer candle. Ideally, the volume should be higher than average. This indicates that there is strong buying interest and that the reversal is more likely to be sustained.
Set Stop-Loss Orders
Always set stop-loss orders to manage your risk. A common strategy is to place the stop-loss order just below the low of the stock hammer candle. This limits your potential losses if the reversal fails to materialize.
Consider the Timeframe
The effectiveness of the stock hammer candle can vary depending on the timeframe. It tends to be more reliable on longer timeframes, such as daily or weekly charts, than on shorter timeframes, such as hourly charts. This is because longer timeframes filter out some of the noise and provide a clearer picture of the overall trend.
Examples of Stock Hammer Candles in Action
Let’s look at a couple of hypothetical examples to illustrate how the stock hammer candle can be used in trading:
Example 1: Bullish Reversal
Imagine a stock that has been trending downwards for several weeks. A stock hammer candle forms near a key support level. The lower shadow of the hammer tests this support level, indicating that buyers are defending it. The next day, the stock opens higher and closes above the high of the hammer, confirming the bullish reversal. A trader might enter a long position at this point, placing a stop-loss order just below the low of the hammer.
Example 2: False Signal
Now, consider another scenario where a stock hammer candle forms after a downtrend. However, the volume is low, and the subsequent candlestick fails to close above the high of the hammer. In this case, the bullish signal is not confirmed, and the trader should avoid entering a long position. This highlights the importance of waiting for confirmation and considering other factors, such as volume and market context.
Limitations of the Stock Hammer Candle
While the stock hammer candle can be a useful indicator, it’s important to be aware of its limitations:
- False Signals: Like all technical indicators, the stock hammer candle can produce false signals. It’s crucial to wait for confirmation and use other indicators to validate the signal.
- Subjectivity: Identifying a stock hammer candle can be somewhat subjective. Different traders may interpret the same candlestick differently.
- Market Context: The effectiveness of the stock hammer candle depends on the overall market context. It may be less reliable in highly volatile or uncertain market conditions.
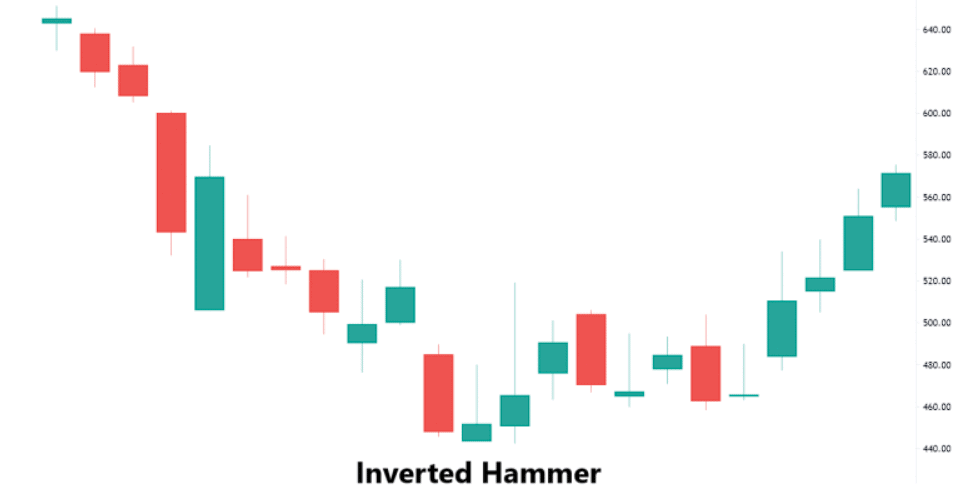
The Inverted Hammer
It is important to note the existence of the inverted hammer. An inverted hammer is the opposite of the hammer. It is a single candlestick pattern that occurs after a downtrend and signals a potential reversal to the upside. It’s characterized by a small body, a long upper shadow (or wick), and little or no lower shadow. The long upper shadow indicates that buyers initially pushed the price higher, but sellers then stepped in and drove the price back down, suggesting a shift in momentum.
Conclusion
The stock hammer candle is a valuable tool for identifying potential bullish reversals in stock prices. By understanding its characteristics, how to identify it on a chart, and how to use it in conjunction with other indicators, traders can improve their decision-making and increase their chances of success. However, it’s important to remember that the stock hammer candle is not a foolproof indicator and should be used with caution and in combination with other analysis techniques. Always wait for confirmation, consider the market context, and manage your risk effectively. Mastering the interpretation of the stock hammer candle can give you a competitive edge in the stock market, allowing you to spot potential buying opportunities and capitalize on market reversals. Remember to always do your own research and consult with a financial advisor before making any investment decisions. The stock hammer candle is just one piece of the puzzle, and a well-rounded understanding of technical analysis is essential for successful trading.
