Understanding Parabolic Price Movements: Identifying and Trading Exponential Growth
In the dynamic world of financial markets, understanding price movements is crucial for making informed investment decisions. One particularly compelling pattern is the parabolic price movement. This article delves into the intricacies of parabolic price action, exploring its characteristics, the underlying psychology driving it, and strategies for identifying and potentially profiting from these exponential growth phases. We’ll also discuss the inherent risks and how to manage them effectively.
What is a Parabolic Price Movement?
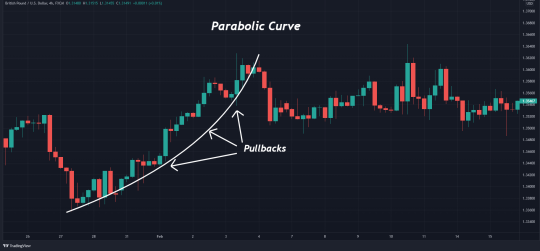
A parabolic price movement describes a rapid and almost vertical increase in the price of an asset. It resembles a parabola on a chart, hence the name. This type of movement is characterized by accelerating momentum, where each successive price increase is larger and faster than the previous one. The parabolic price action is often driven by strong bullish sentiment, fueled by factors such as positive news, technological breakthroughs, or simply fear of missing out (FOMO).
Unlike a gradual uptrend, a parabolic price surge is unsustainable in the long run. The steeper the curve, the higher the likelihood of a sharp correction or crash. Identifying these patterns early can present opportunities for both long and short positions, but it also requires a cautious and disciplined approach.
Characteristics of a Parabolic Price Trend
- Rapid Price Increase: The most obvious characteristic is the swift and significant rise in price.
- Increasing Volume: Volume typically increases alongside the price, indicating strong buying pressure. Higher volume confirms the strength of the trend.
- Decreasing Pullbacks: Pullbacks or corrections become shallower and less frequent as the trend progresses. Buyers quickly absorb any selling pressure.
- Steep Trendline: Drawing a trendline along the lows of the price action will reveal a very steep angle, reflecting the exponential growth.
- Euphoric Sentiment: Market participants become increasingly optimistic, often ignoring fundamental valuations and focusing solely on short-term gains.
The Psychology Behind Parabolic Moves
Parabolic price movements are heavily influenced by human psychology. Fear of missing out (FOMO) plays a significant role as investors see the price rapidly increasing and rush to buy in, further fueling the rally. This creates a self-fulfilling prophecy, where the more people buy, the higher the price goes, attracting even more buyers. This positive feedback loop can continue for a surprisingly long time, but eventually, the euphoria fades.
Greed and the desire for quick profits also contribute to parabolic price action. Investors may abandon their usual risk management strategies in pursuit of high returns, leading to reckless decision-making. Once the price reaches unsustainable levels, early investors begin to take profits, triggering a cascade of selling that can lead to a rapid and devastating crash.
Identifying Parabolic Price Patterns
While predicting the exact moment a parabolic price movement will begin or end is impossible, there are several technical indicators and chart patterns that can help identify potential opportunities:
Moving Averages
A short-term moving average, such as the 9-day or 20-day EMA (Exponential Moving Average), can provide valuable insights. When the price consistently stays above the moving average and the moving average itself is rising rapidly, it suggests a strong uptrend that could be developing into a parabolic price movement. Conversely, when the price breaks below the moving average, it could signal a potential trend reversal.
Relative Strength Index (RSI)
The RSI is a momentum indicator that measures the magnitude of recent price changes to evaluate overbought or oversold conditions in the price of a stock or other asset. An RSI value above 70 typically indicates an overbought condition, suggesting that the price may be due for a correction. However, during a parabolic price move, the RSI can remain in overbought territory for an extended period, indicating sustained buying pressure. It’s crucial to use the RSI in conjunction with other indicators and chart patterns to confirm potential trading signals.
Volume Analysis
As mentioned earlier, increasing volume is a key characteristic of parabolic price movements. Look for significant spikes in volume that accompany the price increases. This confirms that the rally is supported by strong buying pressure. Conversely, a decrease in volume while the price is still rising could be a warning sign that the trend is losing momentum.
Chart Patterns
Certain chart patterns, such as flags and pennants, can indicate a continuation of the uptrend and potentially lead to a parabolic price surge. These patterns typically form after a strong initial move and represent a period of consolidation before the price resumes its upward trajectory.
Trading Strategies for Parabolic Moves
Trading parabolic price movements can be highly profitable, but it also carries significant risk. Here are some strategies to consider:
Riding the Trend
The most straightforward approach is to buy into the trend and hold the position as long as the price continues to rise. This requires a strong stomach and the ability to withstand volatility. Use a trailing stop-loss order to protect your profits and limit your potential losses. A trailing stop-loss automatically adjusts as the price moves in your favor, locking in gains while providing downside protection.
Shorting the Top
Attempting to short the top of a parabolic price move is a high-risk, high-reward strategy. It requires identifying signs of exhaustion, such as a decrease in volume, a break below a key moving average, or a bearish candlestick pattern. Use a tight stop-loss order to limit your potential losses, as the price can continue to rise unexpectedly.
Waiting for the Pullback
A more conservative approach is to wait for a pullback or correction before entering a long position. This allows you to buy at a lower price and with less risk. Look for support levels where the price might bounce, such as previous highs or Fibonacci retracement levels.
Risk Management is Key
No matter which strategy you choose, risk management is paramount when trading parabolic price movements. The potential for rapid and significant losses is high, so it’s crucial to:
- Use Stop-Loss Orders: Always use stop-loss orders to limit your potential losses. Place your stop-loss at a level that you are comfortable with, based on your risk tolerance and the volatility of the asset.
- Manage Your Position Size: Don’t risk more than a small percentage of your capital on any single trade. A common rule of thumb is to risk no more than 1-2% of your trading account on each trade.
- Avoid Overleveraging: Using excessive leverage can magnify your profits, but it can also magnify your losses. Be cautious when using leverage, especially when trading volatile assets.
- Be Disciplined: Stick to your trading plan and avoid making impulsive decisions based on emotions. Don’t let greed or fear cloud your judgment.
Examples of Parabolic Price Moves
Throughout history, numerous assets have experienced parabolic price movements. Some notable examples include:
- Bitcoin in 2017: The cryptocurrency surged from under $1,000 at the beginning of the year to nearly $20,000 by December, before crashing back down.
- GameStop in 2021: Driven by a short squeeze orchestrated by retail investors on Reddit, GameStop’s stock price skyrocketed from around $20 to over $400 in a matter of days. [See also: GameStop Short Squeeze Explained]
- Various Dot-Com Stocks in the late 1990s: Many internet companies experienced parabolic price increases during the dot-com bubble, only to see their stock prices collapse when the bubble burst.
Conclusion
Parabolic price movements represent a fascinating and potentially lucrative phenomenon in the financial markets. Understanding the characteristics, psychology, and risk management principles associated with these moves is essential for successful trading. By combining technical analysis, sound risk management, and a disciplined approach, traders can potentially profit from parabolic price action while minimizing their exposure to risk. Remember that no trading strategy guarantees success, and it’s crucial to continuously learn and adapt to the ever-changing market conditions. Always conduct thorough research and consult with a financial advisor before making any investment decisions. A parabolic price can be exciting, but caution is key.
