Unlocking Trading Secrets: A Deep Dive into the Momentum Squeeze Indicator
In the fast-paced world of financial markets, traders are constantly seeking an edge. The Momentum Squeeze Indicator is one such tool that has gained considerable traction among technical analysts. This indicator aims to identify periods of consolidation followed by potential breakouts, offering traders opportunities to capitalize on significant price movements. But what exactly is the Momentum Squeeze Indicator, and how can it be effectively used in trading strategies?
Understanding the Core Concepts
The Momentum Squeeze Indicator is built upon the concept of volatility compression. Volatility refers to the degree of variation of a trading price series over time, and when volatility compresses, it often precedes a period of expansion. The indicator attempts to identify these periods of low volatility, suggesting that a significant price move is imminent. It does this by combining Bollinger Bands and Keltner Channels.
- Bollinger Bands: These bands are plotted at standard deviation levels above and below a simple moving average (SMA). They expand and contract based on market volatility.
- Keltner Channels: These channels are based on the Average True Range (ATR) and are plotted around an exponential moving average (EMA).
The Momentum Squeeze Indicator signals a squeeze when the Bollinger Bands fall entirely inside the Keltner Channels. This indicates a period of low volatility and potential energy buildup, setting the stage for a possible breakout.
How the Momentum Squeeze Indicator Works
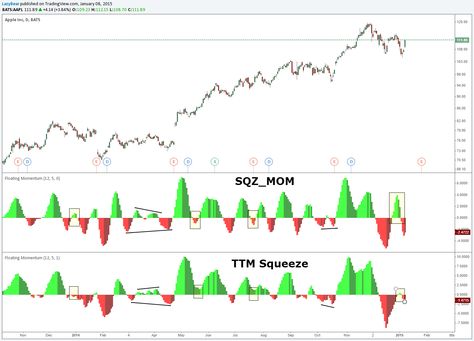
The indicator typically uses a visual representation, often a histogram, to show the squeeze. When the Bollinger Bands are inside the Keltner Channels, the histogram might display a specific color (e.g., red dots) to indicate the squeeze is active. Once the Bollinger Bands start to move outside the Keltner Channels, the histogram changes color (e.g., green dots), signaling the squeeze release and potential breakout.
Here’s a breakdown of the mechanics:
- Squeeze On: Bollinger Bands are fully contained within the Keltner Channels. The histogram shows the squeeze is active.
- Squeeze Release: Bollinger Bands start to break out of the Keltner Channels. The histogram indicates the release, suggesting a possible price movement.
- No Squeeze: Bollinger Bands are outside the Keltner Channels, indicating normal volatility.
Interpreting the Signals
While the Momentum Squeeze Indicator can be a valuable tool, it’s crucial to understand how to interpret its signals effectively. A squeeze does not guarantee a breakout in either direction. It simply indicates that a significant move is likely to occur. Therefore, traders need to combine the indicator with other technical analysis tools and strategies to confirm the direction of the potential breakout.
Consider these points when interpreting the signals:
- Directional Bias: Use other indicators or chart patterns to determine the likely direction of the breakout. For example, look for support and resistance levels, trendlines, or candlestick patterns.
- Volume Confirmation: A breakout accompanied by high volume is generally more reliable than a breakout with low volume.
- Market Context: Consider the overall market conditions and news events that might influence the price movement.
Implementing the Momentum Squeeze Indicator in Trading Strategies
The Momentum Squeeze Indicator can be integrated into various trading strategies. Here are a few examples:
Breakout Trading
This is the most common strategy used with the Momentum Squeeze Indicator. Traders wait for the squeeze to release and then enter a trade in the direction of the breakout. It’s essential to use stop-loss orders to manage risk in case the breakout fails.
Trend Following
In a trending market, the Momentum Squeeze Indicator can help identify potential entry points. Look for squeezes that occur in the direction of the trend. For example, in an uptrend, wait for a squeeze to release to the upside and then enter a long position.
Range Trading
In a ranging market, the Momentum Squeeze Indicator can identify potential reversals. Look for squeezes that occur near the support or resistance levels of the range. When the squeeze releases, enter a trade in the opposite direction of the breakout.
Advantages and Disadvantages of Using the Momentum Squeeze Indicator
Like any technical indicator, the Momentum Squeeze Indicator has its advantages and disadvantages.
Advantages
- Early Warning: It can provide an early warning of potential breakouts, allowing traders to prepare for significant price movements.
- Objective Signals: The indicator provides objective signals based on mathematical calculations, reducing the impact of subjective bias.
- Versatile: It can be used in various trading strategies and market conditions.
Disadvantages
- False Signals: It can generate false signals, especially in choppy or sideways markets.
- Lagging Indicator: Like most indicators, it is a lagging indicator, meaning it reacts to past price data.
- Requires Confirmation: It requires confirmation from other indicators or chart patterns to improve accuracy.
Practical Examples and Case Studies
To illustrate the practical application of the Momentum Squeeze Indicator, let’s consider a few hypothetical examples.
Example 1: Stock Breakout
Imagine a stock has been trading in a narrow range for several weeks. The Momentum Squeeze Indicator shows that a squeeze is active. Suddenly, the stock breaks out of the range on high volume. A trader could enter a long position, anticipating further upside movement. A stop-loss order would be placed below the breakout level to manage risk.
Example 2: Forex Trend Following
Consider a currency pair that is in a strong uptrend. The Momentum Squeeze Indicator signals a squeeze during a temporary pullback. When the squeeze releases to the upside, a trader could enter a long position, expecting the uptrend to continue. A stop-loss order would be placed below the recent swing low.
Tips for Optimizing the Momentum Squeeze Indicator
To get the most out of the Momentum Squeeze Indicator, consider these tips:
- Adjust the Parameters: Experiment with different settings for the Bollinger Bands and Keltner Channels to find the optimal parameters for your trading style and the specific market you are trading.
- Use Multiple Timeframes: Analyze the indicator on multiple timeframes to get a more comprehensive view of the market.
- Combine with Other Indicators: Use the indicator in conjunction with other technical analysis tools, such as moving averages, oscillators, and chart patterns.
- Backtest Your Strategies: Before implementing any trading strategy with the indicator, backtest it on historical data to assess its performance and identify potential weaknesses.
The Future of the Momentum Squeeze Indicator
As financial markets continue to evolve, the Momentum Squeeze Indicator is likely to remain a valuable tool for traders. Its ability to identify periods of volatility compression and potential breakouts makes it a useful addition to any technical analysis toolkit. However, traders must stay informed about the latest developments and adapt their strategies to the changing market conditions.
The Momentum Squeeze Indicator continues to be refined and enhanced. Future iterations may incorporate artificial intelligence and machine learning to improve the accuracy of its signals and adapt to different market regimes.
Conclusion
The Momentum Squeeze Indicator is a powerful tool that can help traders identify potential breakouts and capitalize on significant price movements. By understanding its core concepts, interpreting its signals effectively, and integrating it into well-defined trading strategies, traders can enhance their decision-making process and improve their overall performance. However, it’s crucial to remember that the indicator is not foolproof and should be used in conjunction with other technical analysis tools and risk management techniques. The Momentum Squeeze Indicator is just one piece of the puzzle in the complex world of trading.
Remember to always conduct thorough research and consult with a financial professional before making any investment decisions. The Momentum Squeeze Indicator is a valuable tool, but responsible trading practices are essential for long-term success.
[See also: Understanding Volatility in Trading]
[See also: Advanced Technical Analysis Techniques]
[See also: Risk Management Strategies for Traders]
