
Decoding the Hammer Pattern in Stocks: A Comprehensive Guide for Traders
The stock market is a complex arena, filled with patterns and signals that traders use to predict future price movements. Among these, the hammer pattern stands out as a potentially bullish indicator. This article provides a comprehensive guide to understanding the hammer pattern in stocks, its characteristics, how to identify it, and how to use it effectively in your trading strategy.
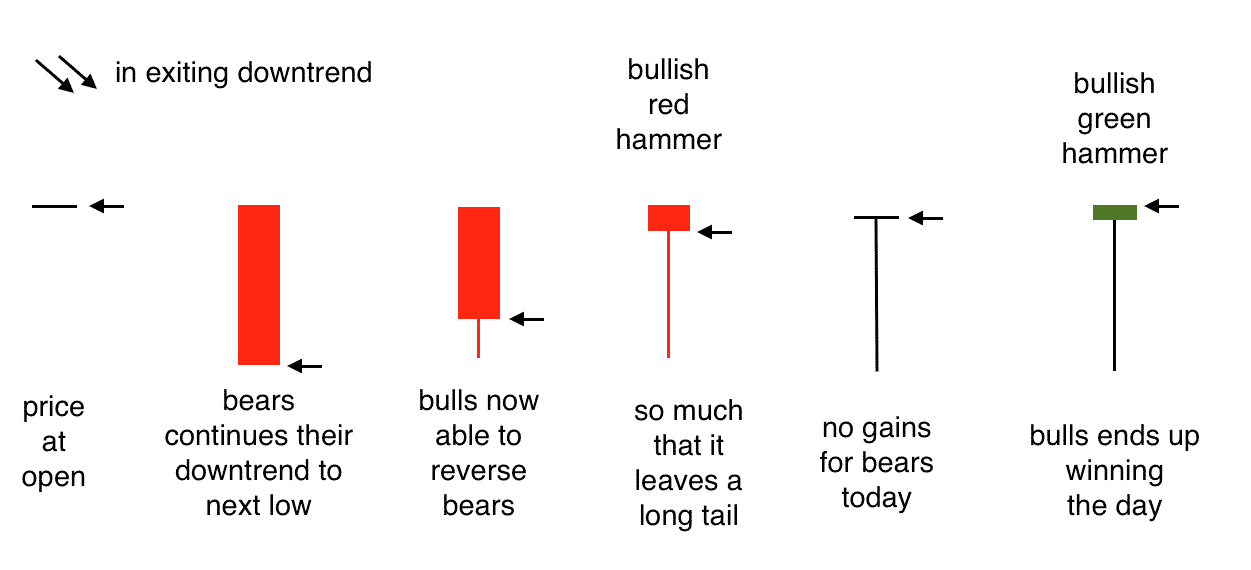
What is the Hammer Pattern?
The hammer pattern is a single candlestick pattern that appears on a price chart. It is formed when a stock’s price moves significantly lower than its opening price, but rallies to close near the opening price. This creates a candlestick with a small body and a long lower shadow (or wick), resembling a hammer. The hammer pattern suggests that despite selling pressure during the period, buyers stepped in to drive the price back up.
Essentially, the hammer pattern is a bullish reversal pattern that suggests a potential bottom in a downtrend. However, it is important to note that the hammer pattern should not be used in isolation. It should be confirmed by other indicators and price action before making trading decisions.
Key Characteristics of a Hammer Pattern
- Small Body: The real body of the candlestick (the difference between the open and close price) is small. The color of the body (bullish or bearish) is less important than the overall shape.
- Long Lower Shadow: The lower shadow should be at least twice the length of the body. This long shadow indicates that sellers initially drove the price down but were ultimately overpowered by buyers.
- Little or No Upper Shadow: Ideally, there should be little or no upper shadow. A long upper shadow would weaken the bullish signal.
- Prior Downtrend: The hammer pattern is only valid if it occurs after a downtrend. It signifies a potential reversal of the downtrend.
How to Identify a Hammer Pattern on a Stock Chart
Identifying the hammer pattern requires careful observation of candlestick charts. Here’s a step-by-step guide:
- Identify a Downtrend: Look for a period where the stock price has been consistently declining. The hammer pattern is a reversal pattern, so it needs a preceding downtrend to reverse.
- Look for the Candlestick Shape: Scan the chart for candlesticks with a small body and a long lower shadow. The lower shadow should be significantly longer than the body.
- Check for Little or No Upper Shadow: Ensure that the candlestick has minimal or no upper shadow.
- Consider Confirmation: The hammer pattern is more reliable when followed by a bullish candlestick on the next trading day. This confirmation provides additional evidence that the downtrend might be reversing.
The Psychology Behind the Hammer Pattern
Understanding the psychology behind the hammer pattern can help traders better interpret its significance. During a downtrend, sellers are in control, driving the price lower. When the hammer pattern forms, it indicates that sellers initially continue to push the price down, creating the long lower shadow. However, at some point during the trading period, buyers step in and aggressively buy the stock, pushing the price back up towards the opening price. This suggests a shift in sentiment from bearish to potentially bullish. The fact that the price closed near the opening, despite the earlier selling pressure, demonstrates the strength of the buyers.
Trading Strategies Using the Hammer Pattern
The hammer pattern can be a valuable tool in a trader’s arsenal, but it should be used in conjunction with other indicators and analysis techniques. Here are some trading strategies that incorporate the hammer pattern:
Confirmation is Key
Never trade solely based on the hammer pattern alone. Wait for confirmation on the next trading day. A bullish candlestick following the hammer pattern suggests that the reversal is likely to continue. This confirmation can be a gap up, a strong bullish candlestick, or a close above the high of the hammer pattern.
Setting Stop-Loss Orders
When trading the hammer pattern, it’s crucial to set a stop-loss order to limit potential losses. A common strategy is to place the stop-loss order slightly below the low of the hammer pattern. This protects your position if the price continues to fall instead of reversing.
Identifying Profit Targets
Determining profit targets is an important aspect of any trading strategy. With the hammer pattern, you can use various techniques to set profit targets, such as:
- Fibonacci Retracement Levels: Use Fibonacci retracement levels to identify potential resistance areas where the price might encounter selling pressure.
- Previous Resistance Levels: Look for previous resistance levels on the chart. These levels can act as potential profit targets.
- Risk-Reward Ratio: Aim for a favorable risk-reward ratio, such as 1:2 or 1:3. This means that your potential profit should be at least twice or three times the amount you’re risking.
Combining with Other Indicators
To increase the reliability of the hammer pattern, combine it with other technical indicators, such as:
- Moving Averages: Use moving averages to identify the overall trend. The hammer pattern is more reliable when it occurs near a key moving average support level.
- Relative Strength Index (RSI): Use the RSI to identify oversold conditions. A hammer pattern that forms when the RSI is in oversold territory can be a strong bullish signal.
- MACD: The Moving Average Convergence Divergence (MACD) can help confirm the potential reversal. Look for a bullish crossover on the MACD to support the hammer pattern.
Examples of the Hammer Pattern in Real-World Scenarios
Let’s look at a hypothetical example. Imagine a stock has been in a downtrend for several weeks, consistently making lower lows. Suddenly, a candlestick forms with a small body and a long lower shadow, with little to no upper shadow – a classic hammer pattern. If this hammer pattern is followed by a bullish candlestick on the next trading day, it could be a strong signal to enter a long position. Traders might set a stop-loss order just below the low of the hammer and aim for a profit target based on previous resistance levels or Fibonacci retracement levels.
Another example could involve a stock that has been falling and approaches a key moving average support level. A hammer pattern forms right at this support level, coinciding with an oversold RSI reading. This confluence of factors increases the likelihood of a successful trade based on the hammer pattern.
Limitations of the Hammer Pattern
While the hammer pattern can be a useful tool, it’s essential to be aware of its limitations:
- False Signals: The hammer pattern can sometimes generate false signals. It’s crucial to wait for confirmation before entering a trade.
- Subjectivity: Identifying the hammer pattern can be subjective. Different traders may interpret candlestick patterns differently.
- Market Context: The effectiveness of the hammer pattern can depend on the overall market context. In a strong downtrend, even a confirmed hammer pattern might fail.
The Inverted Hammer Pattern
It’s worth mentioning the inverted hammer pattern, which is the opposite of the standard hammer pattern. The inverted hammer also forms at the bottom of a downtrend. It has a long upper shadow and a small body at the bottom. It suggests that buyers tried to push the price higher, but sellers ultimately brought it back down. Like the standard hammer pattern, it requires confirmation to be a reliable signal.
Conclusion
The hammer pattern is a valuable tool for traders looking to identify potential bullish reversals in the stock market. By understanding its characteristics, how to identify it, and how to use it in conjunction with other indicators, traders can improve their trading strategies. However, it’s essential to remember that the hammer pattern is not a foolproof signal and should be used with caution and proper risk management. Always wait for confirmation and consider the overall market context before making trading decisions based on the hammer pattern. [See also: Candlestick Charting for Beginners] and [See also: Technical Analysis Indicators].
