Understanding Retracement in Trading: A Comprehensive Guide
In the dynamic world of trading, understanding market movements is crucial for making informed decisions. Among the various concepts traders need to grasp, retracement in trading stands out as a fundamental tool for identifying potential entry and exit points. This guide aims to provide a comprehensive overview of retracement, its significance, and how traders can effectively use it to enhance their strategies. Retracement in trading is a temporary price reversal within a larger trend. It’s essentially a pullback before the price continues in the direction of the prevailing trend. Recognizing these retracements in trading can offer valuable opportunities to enter a trade at a more favorable price.
What is Retracement?
Retracement, also known as a pullback or correction, is a temporary move against the prevailing trend. It’s not a trend reversal but rather a pause or a minor correction before the price resumes its original direction. Understanding this distinction is vital because mistaking a retracement in trading for a reversal can lead to costly trading errors. For instance, if a stock is in an uptrend, a retracement would be a temporary dip in price before it continues to rise. Conversely, in a downtrend, a retracement would be a temporary rise in price before it continues to fall.
Why is Retracement Important?
Retracements are important for several reasons:
- Entry Points: They provide opportunities to enter a trade in the direction of the main trend at a better price. Instead of buying at the peak of an uptrend, waiting for a retracement allows traders to buy at a lower price.
- Risk Management: Retracements allow for better placement of stop-loss orders. By entering a trade during a retracement, traders can set tighter stop-loss levels, reducing potential losses.
- Trend Confirmation: Analyzing the depth and duration of a retracement can help confirm the strength of the underlying trend. A shallow retracement often indicates a strong trend, while a deep retracement might suggest weakening momentum.
Tools for Identifying Retracements
Several technical analysis tools can help traders identify and analyze retracements:
Fibonacci Retracement
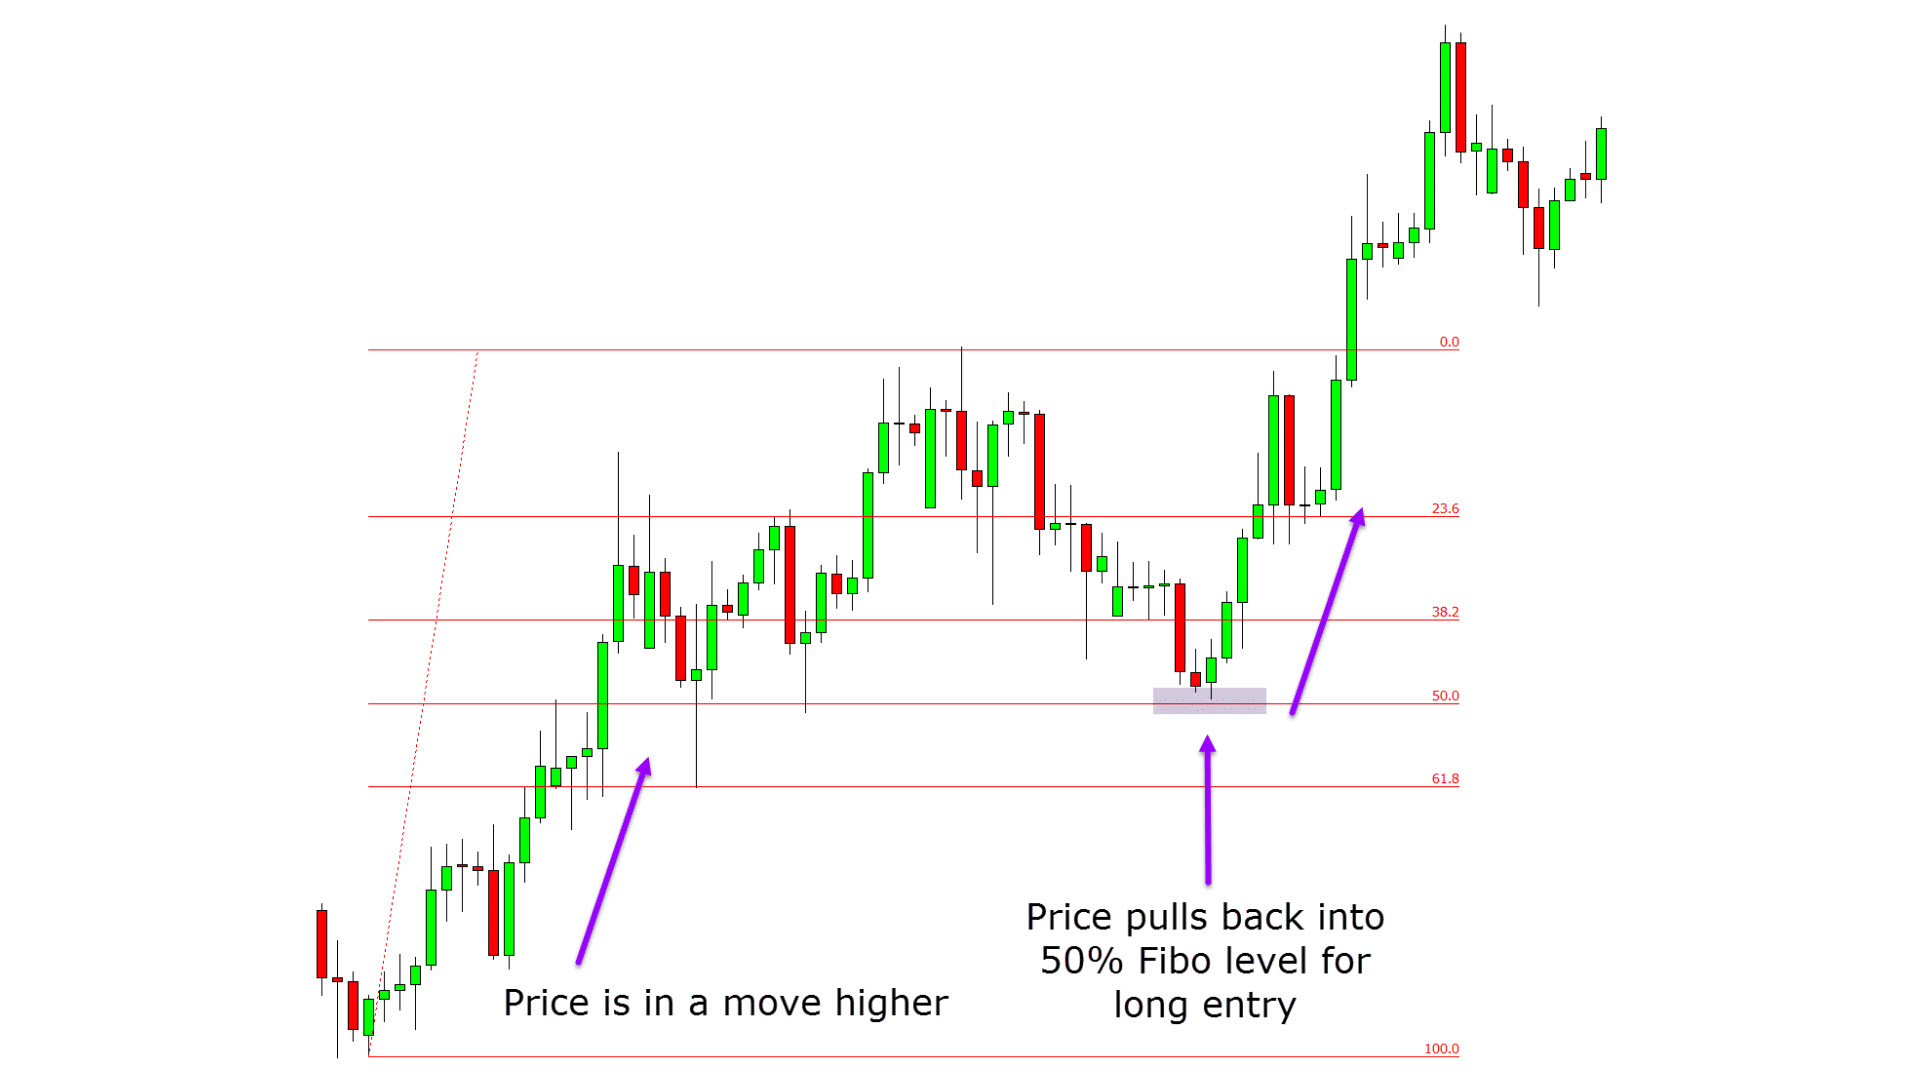
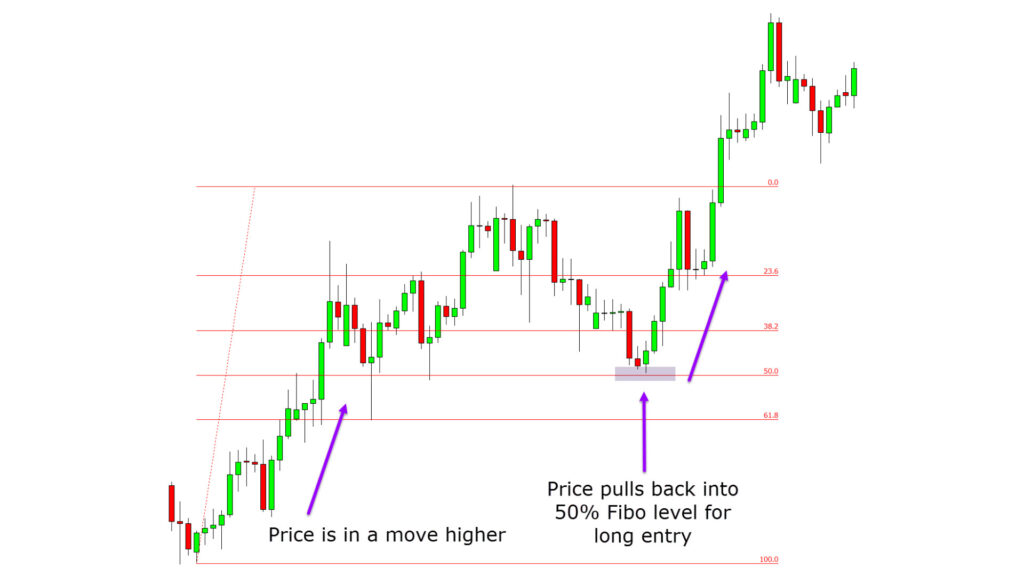
Fibonacci retracement levels are horizontal lines that indicate potential support and resistance areas where the price might reverse. These levels are derived from the Fibonacci sequence and are commonly set at 23.6%, 38.2%, 50%, 61.8%, and 78.6%. Traders often use these levels to identify potential entry points during a retracement. For example, if a stock is in an uptrend and retraces to the 38.2% Fibonacci level, it might be considered a potential buying opportunity, anticipating a continuation of the uptrend. [See also: Fibonacci Trading Strategies]
Moving Averages
Moving averages (MAs) smooth out price data to create a single flowing line, making it easier to identify the trend’s direction. When the price retraces to a moving average, it can act as a dynamic support or resistance level. For instance, in an uptrend, the 50-day moving average might act as a support level during a retracement. Traders often look for buying opportunities when the price bounces off this moving average. [See also: Using Moving Averages in Trading]
Trendlines
Trendlines are lines drawn on a chart to connect a series of highs or lows, indicating the direction of the trend. During a retracement, the price might pull back to the trendline, which can then act as a support or resistance level. If the price bounces off the trendline, it can signal a continuation of the trend. Conversely, if the price breaks through the trendline, it might indicate a potential trend reversal. [See also: Trendline Trading Techniques]
Support and Resistance Levels
Horizontal support and resistance levels are key areas where the price has previously reversed. These levels can act as potential stopping points during a retracement. Traders often look for the price to retrace to these levels before continuing in the direction of the main trend. Identifying these levels requires analyzing historical price data to pinpoint areas where the price has consistently found support or resistance. [See also: Identifying Support and Resistance Levels]
How to Trade Retracements
Trading retracements involves identifying potential entry points during a pullback and managing risk effectively. Here’s a step-by-step approach:
- Identify the Trend: First, determine the prevailing trend using tools like moving averages or trendlines. Ensure that the market is trending clearly before looking for retracements.
- Find Potential Retracement Levels: Use Fibonacci retracement levels, moving averages, or support and resistance levels to identify potential areas where the price might reverse.
- Wait for Confirmation: Don’t jump into a trade as soon as the price reaches a potential retracement level. Wait for confirmation that the price is indeed reversing. This confirmation could be a bullish candlestick pattern, a bounce off a moving average, or a break above a short-term resistance level.
- Set Stop-Loss Orders: Place a stop-loss order below the retracement level to protect against potential losses if the price continues to fall. A well-placed stop-loss is crucial for managing risk in retracement trading.
- Set Profit Targets: Determine your profit target based on the risk-reward ratio. A common approach is to target a profit that is at least twice the distance to your stop-loss.
Common Mistakes to Avoid
While retracement in trading can be a profitable strategy, it’s essential to avoid common mistakes:
- Mistaking Retracements for Reversals: One of the biggest mistakes is confusing a retracement with a trend reversal. Always confirm the trend before entering a trade and be cautious when the price breaks through key support or resistance levels.
- Ignoring Risk Management: Failing to set stop-loss orders can lead to significant losses if the price continues to move against your position. Always use stop-loss orders to protect your capital.
- Overtrading: Trying to trade every retracement can lead to overtrading and increased transaction costs. Be selective and only trade when you have a clear setup and a well-defined strategy.
- Using Too Many Indicators: Overloading your charts with too many indicators can lead to analysis paralysis. Stick to a few key indicators that you understand well and that complement each other.
Examples of Retracement in Trading
Let’s consider a few examples to illustrate how retracement in trading works:
Example 1: Using Fibonacci Retracement in an Uptrend
Suppose a stock is in a strong uptrend, and you notice that it has retraced to the 38.2% Fibonacci level. You wait for confirmation, such as a bullish candlestick pattern, before entering a long position. You set your stop-loss just below the 38.2% level and your profit target at a level that provides a favorable risk-reward ratio. If the stock bounces off the Fibonacci level and continues its uptrend, you profit from the trade. This demonstrates how Fibonacci retracement levels can be used to identify potential entry points in an uptrend.
Example 2: Using Moving Averages in a Downtrend
Imagine a currency pair is in a downtrend, and the price retraces to the 50-day moving average. You wait for confirmation, such as a bearish candlestick pattern, before entering a short position. You set your stop-loss just above the moving average and your profit target at a level that provides a favorable risk-reward ratio. If the currency pair bounces off the moving average and continues its downtrend, you profit from the trade. This illustrates how moving averages can act as dynamic resistance levels during a retracement in a downtrend.
Advanced Retracement Techniques
Beyond the basics, several advanced techniques can enhance your retracement trading strategy:
- Combining Fibonacci with Other Indicators: Use Fibonacci retracement levels in conjunction with other indicators, such as the Relative Strength Index (RSI) or Moving Average Convergence Divergence (MACD), to confirm potential entry points.
- Trading Retracements in Different Timeframes: Analyze retracements on multiple timeframes to get a more comprehensive view of the market. For example, you might identify a retracement on a daily chart and then look for a more precise entry point on an hourly chart.
- Using Volume Analysis: Pay attention to volume during retracements. Low volume during a retracement can indicate that the pullback is weak and that the trend is likely to continue.
The Psychology of Retracement Trading
Understanding the psychology behind retracements can give you an edge in the market. Retracements often occur because traders who missed the initial move are waiting for an opportunity to enter the market at a better price. Additionally, some traders may be taking profits, causing a temporary pullback. Recognizing these psychological factors can help you anticipate potential retracement levels and make more informed trading decisions. [See also: Trading Psychology Tips]
Conclusion
Retracement in trading is a powerful concept that can significantly improve your trading strategy. By understanding what retracements are, how to identify them using various tools, and how to manage risk effectively, you can increase your chances of success in the market. Remember to always confirm the trend, wait for confirmation signals, and use stop-loss orders to protect your capital. With practice and patience, retracement trading can become a valuable tool in your trading arsenal. The key is to consistently analyze the market, adapt to changing conditions, and refine your strategy based on your trading experience. By mastering retracement in trading, you can navigate market fluctuations with greater confidence and achieve your financial goals.
