Unlocking Market Volatility: A Comprehensive Guide to the Squeeze Indicator
In the dynamic world of financial markets, identifying potential breakout opportunities is crucial for traders seeking to capitalize on price movements. One technical analysis tool that has gained popularity for its ability to pinpoint periods of consolidation and subsequent expansion is the squeeze indicator. This article provides a comprehensive guide to understanding, interpreting, and utilizing the squeeze indicator effectively in your trading strategy.
What is the Squeeze Indicator?
The squeeze indicator, often associated with John Carter’s work, is a volatility indicator designed to identify periods of low volatility that are likely to be followed by periods of high volatility. It essentially highlights moments when price action is consolidating, suggesting a potential buildup of energy that will eventually lead to a significant price move. The core principle behind the squeeze indicator is that markets tend to alternate between periods of contraction (low volatility) and expansion (high volatility).
The squeeze indicator typically combines Bollinger Bands and Keltner Channels. Bollinger Bands measure volatility based on standard deviations from a simple moving average, while Keltner Channels are based on the Average True Range (ATR). When the Bollinger Bands are contained within the Keltner Channels, it signals a squeeze, indicating a period of low volatility. Conversely, when the Bollinger Bands break outside the Keltner Channels, it suggests that volatility is expanding.
How the Squeeze Indicator Works: A Deep Dive
To fully grasp the squeeze indicator, it’s essential to understand the components that comprise it:
- Bollinger Bands: These bands consist of a simple moving average (SMA) and two bands plotted at a certain number of standard deviations above and below the SMA. They dynamically adjust to price volatility, widening during periods of high volatility and narrowing during periods of low volatility.
- Keltner Channels: These channels are based on the Average True Range (ATR), which measures the average price range over a specified period. The Keltner Channels consist of a middle line (typically an Exponential Moving Average) and two channels plotted above and below the middle line, based on the ATR.
- The Squeeze: The squeeze occurs when the Bollinger Bands are completely contained within the Keltner Channels. This indicates that the market is in a period of consolidation and low volatility. The longer the Bollinger Bands remain inside the Keltner Channels, the more significant the potential breakout is likely to be.
Interpreting the Squeeze Indicator
The primary signal generated by the squeeze indicator is the presence or absence of a squeeze. However, interpreting the squeeze effectively requires considering other factors, such as the context of the overall market trend and potential support and resistance levels.
Identifying a Squeeze
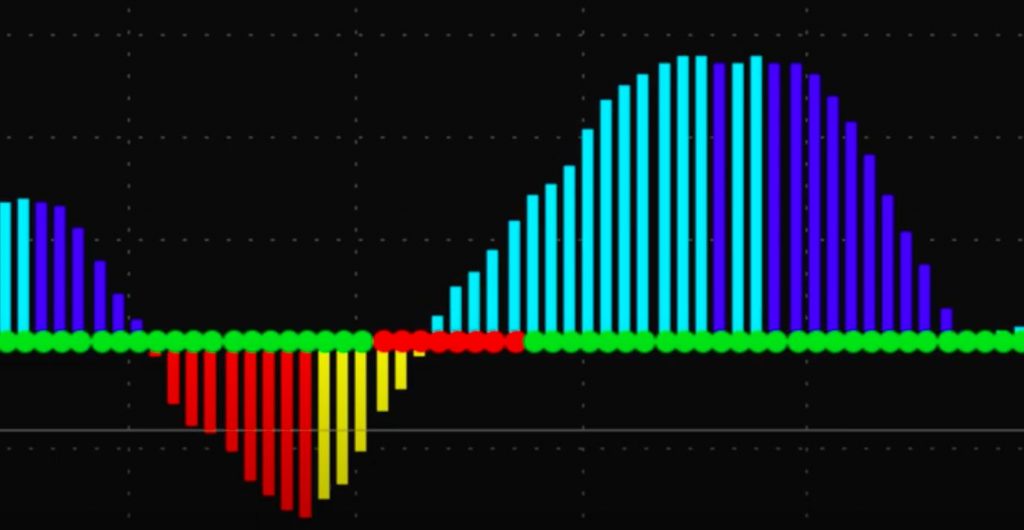
As mentioned earlier, a squeeze is identified when the Bollinger Bands are contained within the Keltner Channels. Many charting platforms visually represent this condition using different colors or shading. For example, the indicator might display a red dot or shaded area when a squeeze is active.
Anticipating a Breakout
The squeeze indicator does not predict the direction of the breakout; it only indicates that a breakout is likely to occur. To determine the potential direction, traders often look for confirmation signals from other indicators or price action patterns. For example, a breakout above a resistance level after a squeeze might signal a potential long trade, while a breakdown below a support level might signal a potential short trade. [See also: Support and Resistance Trading Strategies]
The Squeeze Release
The release of the squeeze occurs when the Bollinger Bands break outside the Keltner Channels. This signifies the start of a period of high volatility and a potential price move. The direction of the breakout determines the potential direction of the trade.
Using the Squeeze Indicator in Trading Strategies
The squeeze indicator can be incorporated into various trading strategies, often in conjunction with other technical indicators and price action analysis. Here are a few examples:
Squeeze Breakout Strategy
This strategy involves identifying stocks or assets that are currently in a squeeze and waiting for a breakout above a resistance level or below a support level. Once the breakout is confirmed, a trader can enter a long or short position, depending on the direction of the breakout. Stop-loss orders should be placed below the breakout level for long positions and above the breakout level for short positions.
Squeeze with Trend Confirmation
This strategy combines the squeeze indicator with a trend-following indicator, such as a moving average or trendline. Traders look for squeezes that occur in the direction of the prevailing trend. For example, if the overall trend is upward, traders would look for squeezes that break out to the upside. This approach helps to filter out false signals and increase the probability of successful trades. [See also: Mastering Moving Averages for Trend Identification]
Squeeze with Momentum Indicators
Combining the squeeze indicator with momentum indicators, such as the Relative Strength Index (RSI) or Moving Average Convergence Divergence (MACD), can provide additional confirmation signals. For example, a squeeze breakout accompanied by an overbought RSI reading might suggest a potential short trade, while a squeeze breakout accompanied by an oversold RSI reading might suggest a potential long trade.
Advantages and Limitations of the Squeeze Indicator
Like any technical indicator, the squeeze indicator has its advantages and limitations. Understanding these aspects can help traders use the indicator more effectively.
Advantages
- Identifies Potential Breakouts: The squeeze indicator is effective at identifying periods of consolidation that are likely to be followed by significant price moves.
- Objective Signals: The indicator provides objective signals based on mathematical calculations, reducing the impact of subjective bias.
- Versatile: The squeeze indicator can be used on various timeframes and asset classes.
Limitations
- False Signals: The squeeze indicator can generate false signals, especially in choppy or sideways markets.
- Lagging Indicator: Like many technical indicators, the squeeze indicator is a lagging indicator, meaning it provides signals based on past price data.
- Requires Confirmation: The squeeze indicator does not predict the direction of the breakout, so it requires confirmation from other indicators or price action analysis.
Tips for Using the Squeeze Indicator Effectively
To maximize the effectiveness of the squeeze indicator, consider the following tips:
- Use in Conjunction with Other Indicators: Combine the squeeze indicator with other technical indicators, such as trend-following indicators and momentum indicators, to improve the accuracy of your trading signals.
- Consider the Overall Market Trend: Trade squeeze breakouts in the direction of the prevailing market trend to increase the probability of success.
- Manage Risk: Always use stop-loss orders to limit your potential losses.
- Practice on a Demo Account: Before trading with real money, practice using the squeeze indicator on a demo account to familiarize yourself with its signals and limitations.
Customizing the Squeeze Indicator
Most charting platforms allow you to customize the settings of the squeeze indicator to suit your trading style and preferences. Some common settings that you can adjust include:
- Moving Average Period: The period of the simple moving average used in the Bollinger Bands.
- Standard Deviation: The number of standard deviations used to calculate the Bollinger Bands.
- ATR Period: The period of the Average True Range (ATR) used in the Keltner Channels.
- Multiplier: The multiplier applied to the ATR to determine the width of the Keltner Channels.
Experimenting with different settings can help you find the optimal configuration for your specific trading style and the assets you are trading.
The Squeeze Indicator in Different Markets
The squeeze indicator can be applied to various financial markets, including stocks, forex, commodities, and cryptocurrencies. However, it’s important to note that the effectiveness of the indicator may vary depending on the market conditions and the specific characteristics of each asset. For example, highly volatile assets may generate more frequent squeeze signals, while less volatile assets may generate fewer signals.
Real-World Examples of the Squeeze Indicator in Action
To illustrate how the squeeze indicator can be used in real-world trading scenarios, let’s look at a few examples:
Example 1: Stock Breakout
A stock has been trading within a narrow range for several weeks, and the squeeze indicator is showing a squeeze. The price then breaks above a resistance level, triggering a long entry. A stop-loss order is placed below the breakout level. The stock continues to rally, and the trader profits from the breakout.
Example 2: Forex Reversal
A currency pair has been trending downward, and the squeeze indicator is showing a squeeze. The price then breaks above a trendline, signaling a potential reversal. A trader enters a long position, anticipating a trend change. A stop-loss order is placed below the trendline. The currency pair reverses its trend, and the trader profits from the reversal.
Conclusion
The squeeze indicator is a valuable tool for identifying potential breakout opportunities in the financial markets. By understanding how the indicator works and how to interpret its signals, traders can improve their ability to capitalize on price movements. However, it’s important to remember that the squeeze indicator is not a foolproof system and should be used in conjunction with other technical indicators and risk management techniques. By incorporating the squeeze indicator into a comprehensive trading strategy, traders can enhance their chances of success in the dynamic world of financial markets. Mastering the squeeze indicator requires practice, patience, and a thorough understanding of market dynamics. With dedication and consistent effort, traders can unlock the potential of this powerful tool and improve their trading performance.
