
Unlocking Profits: Understanding the Hammer Candle in Stock Trading
The stock market is a complex arena filled with patterns and signals that traders use to predict future price movements. Among these, candlestick patterns are highly regarded for their visual representation of price action. One particularly noteworthy pattern is the hammer candle. This article delves into the intricacies of the hammer candle, exploring its formation, significance, and how it can be effectively used in stock trading. Understanding the hammer candle can be a valuable tool in any trader’s arsenal, offering potential insights into market reversals and profit opportunities. The hammer candle is a bullish reversal pattern that signals a potential bottom after a downtrend. Recognizing and correctly interpreting this pattern can provide traders with a strategic advantage.
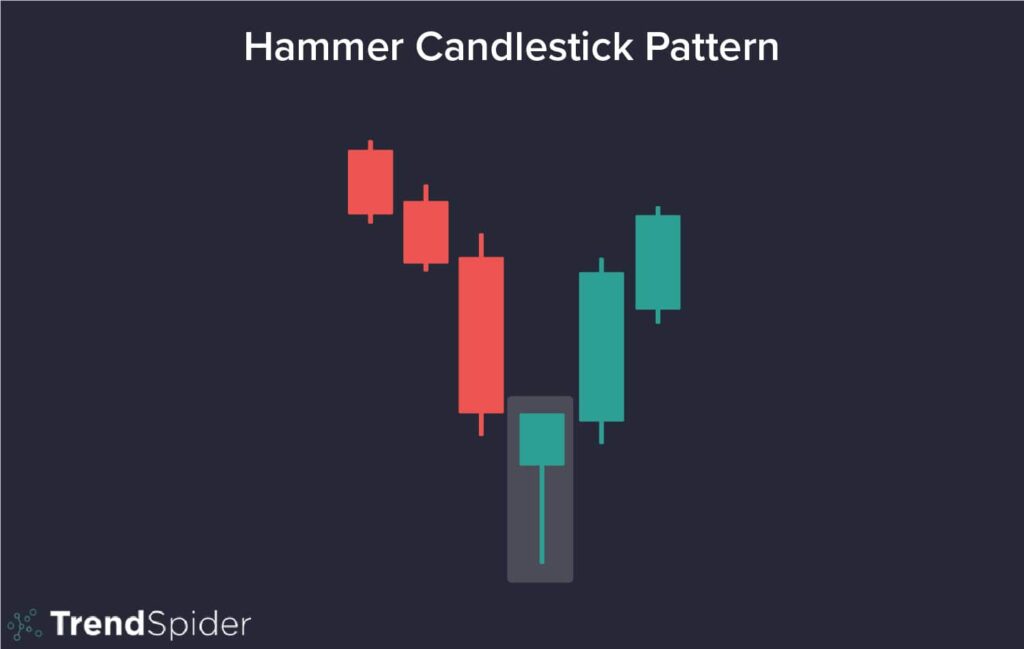
What is a Hammer Candle?
A hammer candle is a single candlestick pattern that forms when a stock’s price moves significantly lower during the day but rallies to close near its opening price. This creates a candlestick with a small body (either bullish or bearish) and a long lower wick, resembling a hammer. The long lower wick indicates that sellers initially drove the price down, but buyers stepped in and pushed the price back up, suggesting a potential shift in market sentiment. The hammer candle is a powerful indicator of a potential trend reversal.
Key Characteristics of a Hammer Candle
- Small Body: The body represents the difference between the opening and closing prices. It can be either bullish (closing price higher than opening price) or bearish (closing price lower than opening price), but the size is relatively small compared to the wick.
- Long Lower Wick: This is the most critical feature. The wick should be at least twice the length of the body. It signifies the extent to which the price declined before buyers regained control.
- Little or No Upper Wick: Ideally, there should be little to no upper wick. A significant upper wick can weaken the signal.
- Occurs After a Downtrend: The hammer candle is only valid if it appears after a period of declining prices. It suggests that the downtrend may be losing momentum.
How to Identify a Hammer Candle
Identifying a hammer candle is relatively straightforward once you know what to look for. Here’s a step-by-step guide:
- Look for a Downtrend: Ensure that the stock has been in a downtrend before you start looking for the pattern.
- Identify the Candlestick: Scan the chart for a candlestick with a small body and a long lower wick. The wick should be significantly longer than the body (at least twice the size).
- Check for Minimal Upper Wick: Verify that there is little to no upper wick.
- Confirm the Reversal: The hammer candle is a signal, not a guarantee. Look for confirmation in the subsequent candles. A bullish candle following the hammer candle strengthens the signal.
The Psychology Behind the Hammer Candle
Understanding the psychology behind the hammer candle is crucial for interpreting its significance. During a downtrend, sellers are in control, pushing the price lower. When a hammer candle forms, it indicates that sellers initially continued to drive the price down during the trading session, creating the long lower wick. However, at some point, buyers stepped in and aggressively bought the stock, pushing the price back up towards the opening price. This sudden shift in buying pressure suggests that the downtrend may be losing steam and that buyers are gaining control. The hammer candle is a visual representation of this battle between bulls and bears.
Difference Between a Hammer and a Hanging Man
It’s important to distinguish the hammer candle from another similar pattern called the hanging man. While both have the same shape (small body and long lower wick), their significance differs based on their location within a trend.
- Hammer: Appears after a downtrend and signals a potential bullish reversal.
- Hanging Man: Appears after an uptrend and signals a potential bearish reversal.
The key difference lies in the preceding trend. A hammer candle suggests that buyers are stepping in after a period of selling pressure, while a hanging man suggests that sellers are gaining control after a period of buying pressure. Mistaking one for the other can lead to incorrect trading decisions.
Trading Strategies Using the Hammer Candle
The hammer candle can be incorporated into various trading strategies. Here are a few common approaches:
Confirmation is Key
Never trade solely based on the hammer candle. Always wait for confirmation in the subsequent candles. A bullish candle closing above the high of the hammer candle is a strong confirmation signal. This indicates that buyers are indeed taking control and that the price is likely to move higher.
Using Stop-Loss Orders
Implement stop-loss orders to manage risk. A common approach is to place the stop-loss order slightly below the low of the hammer candle. This limits potential losses if the price fails to move higher and the downtrend continues.
Combining with Other Indicators
Enhance the reliability of the hammer candle by combining it with other technical indicators. For example, using the Relative Strength Index (RSI) to confirm that the stock is oversold can strengthen the bullish signal. Similarly, looking at volume patterns can provide additional insights into the strength of the reversal.
Example Strategy: Hammer Candle with RSI
- Identify a Downtrend: Find a stock that has been in a consistent downtrend.
- Look for a Hammer Candle: Spot a hammer candle forming at the end of the downtrend.
- Check RSI: Confirm that the RSI is below 30, indicating an oversold condition.
- Wait for Confirmation: Wait for a bullish candle to close above the high of the hammer candle.
- Enter Trade: Enter a long position (buy the stock) after the confirmation candle.
- Set Stop-Loss: Place a stop-loss order slightly below the low of the hammer candle.
- Set Target: Set a profit target based on your risk-reward ratio or previous resistance levels.
Limitations of the Hammer Candle
While the hammer candle can be a valuable tool, it’s important to be aware of its limitations:
- False Signals: Like all technical indicators, the hammer candle can generate false signals. The price may not always reverse after a hammer candle forms.
- Market Context: The effectiveness of the hammer candle depends on the overall market context. In a strong downtrend, the hammer candle may be less reliable.
- Confirmation Required: Always wait for confirmation before making a trading decision. Relying solely on the hammer candle can lead to losses.
Real-World Examples
To illustrate the use of the hammer candle, let’s consider a hypothetical example. Suppose you are tracking a stock that has been in a downtrend for several weeks. One day, you notice a hammer candle forming. The body is small, the lower wick is long, and there is minimal upper wick. The next day, a bullish candle closes above the high of the hammer candle. This confirms the reversal signal. You decide to enter a long position, placing a stop-loss order below the low of the hammer candle. Over the next few days, the stock price rises, allowing you to reach your profit target and close the trade with a gain. This hammer candle provided an early signal of a potential trend reversal.
Conversely, imagine a scenario where you spot a hammer candle, but the subsequent candles fail to confirm the reversal. The price remains stagnant or continues to decline. In this case, the hammer candle was a false signal, and you would avoid entering a long position, preventing a potential loss. The importance of confirmation cannot be overstated.
Advanced Considerations
Experienced traders often incorporate more advanced techniques to refine their use of the hammer candle. These include:
- Volume Analysis: Observing volume patterns can provide additional insights. A surge in volume during the formation of the hammer candle or during the confirmation candle can strengthen the signal.
- Fibonacci Retracement: Combining the hammer candle with Fibonacci retracement levels can help identify potential support and resistance levels, improving the accuracy of entry and exit points.
- Multiple Timeframe Analysis: Analyzing hammer candles across multiple timeframes (e.g., daily, weekly) can provide a more comprehensive view of the market and improve the reliability of the signals.
Conclusion
The hammer candle is a powerful candlestick pattern that can provide valuable insights into potential trend reversals in the stock market. By understanding its formation, significance, and limitations, traders can incorporate it into their trading strategies to identify profit opportunities. However, it’s crucial to remember that the hammer candle is just one tool among many, and it should always be used in conjunction with other technical indicators and risk management techniques. Always wait for confirmation and be prepared to adjust your strategy based on changing market conditions. The hammer candle, when properly understood and applied, can significantly enhance your trading success. The hammer candle is a valuable pattern to recognize, but proper risk management is crucial. [See also: Understanding Candlestick Patterns for Stock Trading]
