Understanding Retracement: A Key Concept in Financial Trading
In the dynamic world of financial markets, understanding price movements is paramount for successful trading. One such crucial concept is retracement. This article delves into the intricacies of retracement, exploring its definition, identification, significance, and practical applications in trading strategies. A retracement, in essence, is a temporary price reversal that occurs within a larger trend. It’s a breather, a pause, or a slight pullback before the prevailing trend potentially resumes. Recognizing and interpreting retracements can provide traders with valuable entry and exit points, ultimately enhancing their profitability and risk management.
What is Retracement?
A retracement is a short-term price movement against the primary trend. Imagine a stock price steadily climbing upwards. This upward movement represents the primary trend. During this ascent, the price might dip temporarily before continuing its upward trajectory. This temporary dip is a retracement. It’s essential to distinguish a retracement from a reversal. A retracement is a temporary pause, while a reversal indicates a change in the overall trend direction. Retracements are often viewed as opportunities to enter a trade in the direction of the underlying trend at a more favorable price.
Identifying Retracements
Several tools and techniques can help traders identify potential retracements. Some of the most common include:
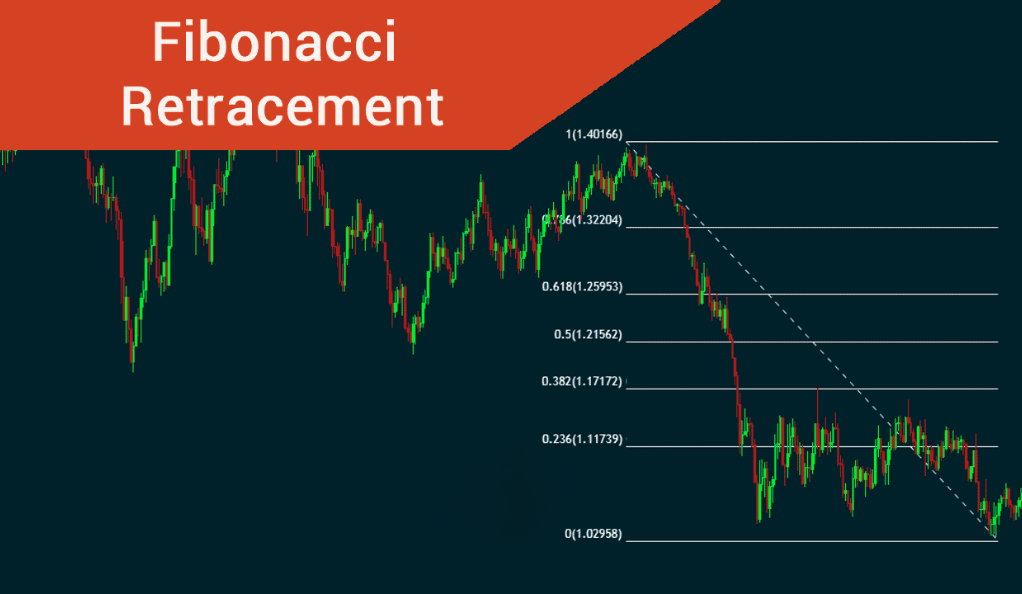
- Fibonacci Retracement Levels: Based on the Fibonacci sequence, these levels (23.6%, 38.2%, 50%, 61.8%, and 78.6%) are used to identify potential support and resistance areas where a retracement might end.
- Trendlines: Drawing trendlines on a chart can help identify the direction of the primary trend. A retracement will typically occur when the price moves against the trendline.
- Moving Averages: Moving averages smooth out price data and can help identify potential support and resistance levels. A retracement might find support at a moving average.
- Chart Patterns: Certain chart patterns, such as flags and pennants, often indicate retracements within a larger trend.
- Volume Analysis: Analyzing trading volume during a potential retracement can provide clues about its strength and likelihood of continuation. Low volume during the retracement might suggest it’s a temporary pause.
The Significance of Retracements in Trading
Understanding retracements is crucial for several reasons:
- Entry Points: Retracements offer opportunities to enter a trade in the direction of the primary trend at a better price. Instead of buying at the peak of an upward trend, traders can wait for a retracement to buy at a lower price.
- Exit Points: Retracements can also help traders identify potential exit points. If a trader is already in a profitable position, they might choose to exit during a retracement to lock in profits.
- Risk Management: By understanding retracements, traders can place stop-loss orders more effectively. A stop-loss order is an order to sell a security if it reaches a certain price, limiting potential losses. Identifying potential retracement levels can help traders place stop-loss orders below these levels.
- Trend Confirmation: Observing how a market reacts to a retracement can provide clues about the strength of the underlying trend. If the price quickly bounces back after a retracement, it suggests the trend is strong.
Trading Strategies Using Retracements
Several trading strategies utilize the concept of retracement. Here are a few examples:
Fibonacci Retracement Strategy
This strategy involves using Fibonacci retracement levels to identify potential entry points. Traders draw Fibonacci levels on a chart, connecting the high and low points of a trend. They then look for price to retrace to a Fibonacci level and find support or resistance. For example, in an uptrend, a trader might look for the price to retrace to the 38.2% or 50% Fibonacci level and then bounce back upwards. [See also: Fibonacci Trading Strategies]
Trendline Retracement Strategy
This strategy involves using trendlines to identify potential retracements. Traders draw trendlines on a chart to identify the direction of the primary trend. They then look for the price to retrace to the trendline and find support or resistance. For example, in an uptrend, a trader might look for the price to retrace to the trendline and then bounce back upwards.
Moving Average Retracement Strategy
This strategy involves using moving averages to identify potential retracements. Traders use moving averages to identify potential support and resistance levels. They then look for the price to retrace to a moving average and find support or resistance. For example, in an uptrend, a trader might look for the price to retrace to a 50-day moving average and then bounce back upwards.
Retracement vs. Reversal
It is important to distinguish between a retracement and a reversal. A retracement is a temporary price movement against the primary trend, while a reversal indicates a change in the overall trend direction. Confusing the two can lead to costly trading errors. Key differences include:
- Duration: Retracements are typically short-lived, while reversals can last for an extended period.
- Magnitude: Retracements are usually smaller in magnitude compared to reversals.
- Trend Confirmation: After a retracement, the primary trend is expected to resume. After a reversal, a new trend is established.
Limitations of Retracement Analysis
While retracement analysis can be a valuable tool, it’s important to be aware of its limitations:
- Subjectivity: Identifying retracements can be subjective, as different traders may interpret price movements differently.
- False Signals: Retracement analysis can generate false signals. The price might retrace to a level, but then fail to find support or resistance and continue moving in the opposite direction.
- Market Volatility: In highly volatile markets, retracements can be erratic and unpredictable.
- Not a Standalone Strategy: Retracement analysis should not be used as a standalone trading strategy. It should be combined with other technical indicators and fundamental analysis.
Real-World Examples of Retracement
Consider a stock in a strong uptrend. The stock price increases steadily for several weeks. Suddenly, the price experiences a temporary dip. This dip is a retracement. Traders using Fibonacci retracement levels might identify a key support level at the 38.2% retracement. If the price bounces back from this level, it confirms the retracement and provides a potential entry point for traders looking to buy the stock. Conversely, if the price breaks through the 38.2% level, it might indicate a deeper retracement or even a potential reversal.
Another example could be in the currency market. The EUR/USD pair is trending downwards. After a significant drop, the price experiences a temporary rise. This rise is a retracement. Traders might use trendlines to identify the downtrend and look for the price to retrace to the trendline and then resume its downward trajectory. [See also: Technical Analysis for Beginners]
Conclusion
Retracement is a fundamental concept in financial trading that can provide traders with valuable insights into price movements. By understanding how to identify and interpret retracements, traders can improve their entry and exit points, manage risk more effectively, and ultimately enhance their profitability. However, it’s important to remember that retracement analysis is not a foolproof method and should be used in conjunction with other technical indicators and fundamental analysis. Continuous learning and adaptation are key to mastering the art of trading with retracements.
