Unlocking Market Secrets: Mastering the Bollinger Squeeze for Trading Success
In the dynamic world of financial markets, traders and investors constantly seek reliable tools and strategies to identify potential trading opportunities. One such tool, widely recognized for its ability to pinpoint periods of market consolidation and potential breakout, is the Bollinger Squeeze. This article delves into the intricacies of the Bollinger Squeeze, explaining its components, interpretation, and practical application in trading strategies. Understanding how to leverage the Bollinger Squeeze can significantly enhance a trader’s ability to anticipate market movements and improve profitability. The Bollinger Squeeze is not a crystal ball, but a valuable tool in the arsenal of a well-informed trader.
Understanding Bollinger Bands: The Foundation of the Squeeze
Before diving into the Bollinger Squeeze, it’s crucial to understand Bollinger Bands, the foundation upon which the squeeze is built. Developed by John Bollinger in the 1980s, Bollinger Bands consist of three lines plotted on a price chart:
- Middle Band: Typically a 20-day simple moving average (SMA). This represents the average price over the specified period.
- Upper Band: Calculated by adding two standard deviations to the middle band. This band represents the upper range of expected price movement.
- Lower Band: Calculated by subtracting two standard deviations from the middle band. This band represents the lower range of expected price movement.
The standard deviation is a statistical measure of price volatility. When volatility is high, the bands widen, and when volatility is low, the bands contract. This dynamic adjustment makes Bollinger Bands a useful tool for assessing market volatility and identifying potential overbought or oversold conditions.
What is the Bollinger Squeeze?
The Bollinger Squeeze occurs when the upper and lower Bollinger Bands move closer together, constricting the price action. This contraction signifies a period of low volatility and market consolidation. The underlying principle is that periods of low volatility are often followed by periods of high volatility. Therefore, a Bollinger Squeeze suggests that a significant price move is imminent.
Think of it like a coiled spring: the tighter the spring is wound (the narrower the bands), the greater the potential energy stored, and the more explosive the subsequent release (the price breakout) is likely to be. The Bollinger Squeeze doesn’t predict the direction of the breakout, only that a breakout is likely to occur.
Identifying the Bollinger Squeeze
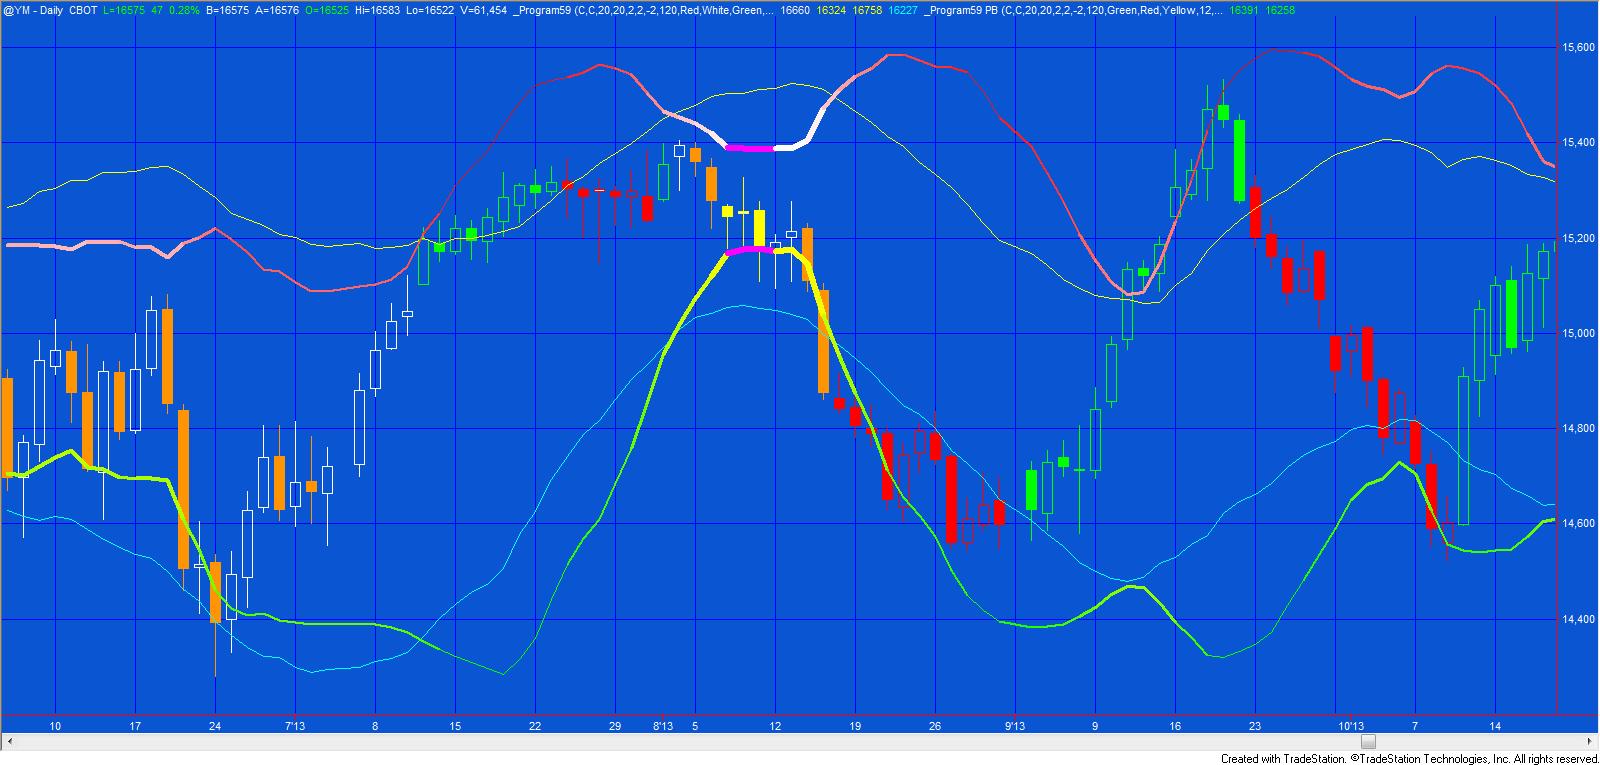
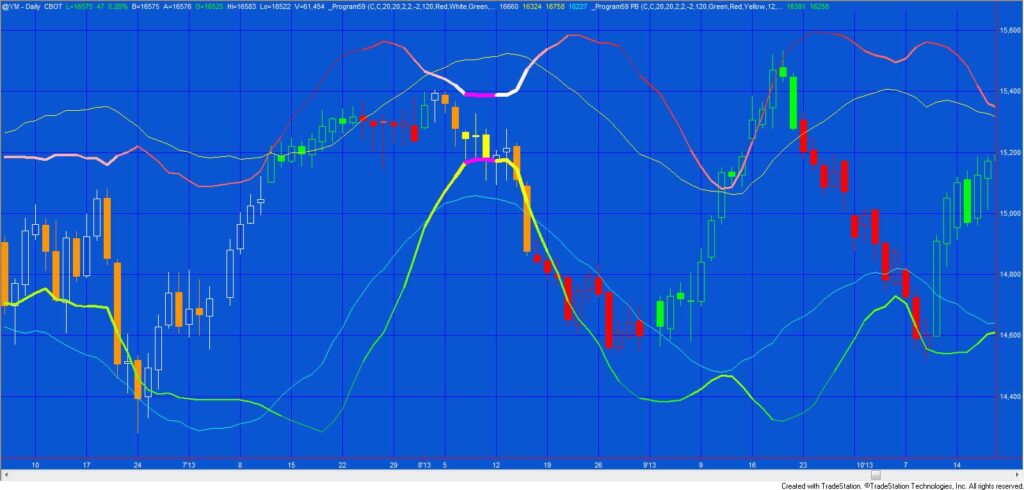
Visually identifying the Bollinger Squeeze on a price chart is relatively straightforward. Look for periods where the upper and lower bands narrow significantly, squeezing the price action into a tighter and tighter range. Many trading platforms offer Bollinger Bands as a built-in technical indicator, making identification even easier. Some platforms also offer automated alerts when a Bollinger Squeeze is detected.
However, relying solely on visual inspection can be subjective. To add more objectivity, traders often use the BandWidth indicator, which measures the percentage difference between the upper and lower bands. A low BandWidth value confirms the presence of a Bollinger Squeeze.
Interpreting the Bollinger Squeeze
While the Bollinger Squeeze signals an impending price move, it doesn’t tell you which direction the price will move. Therefore, it’s crucial to use other technical indicators and analysis techniques to confirm the potential breakout direction. Here are some common strategies:
- Confirming Direction with Other Indicators: Use oscillators like the Relative Strength Index (RSI) or Moving Average Convergence Divergence (MACD) to identify overbought or oversold conditions. A Bollinger Squeeze followed by a bullish RSI signal could indicate an upward breakout, while a bearish MACD signal could suggest a downward breakout.
- Analyzing Price Action: Look for candlestick patterns that suggest potential bullish or bearish momentum. For example, a bullish engulfing pattern forming near the lower band during a Bollinger Squeeze could signal a potential upward breakout.
- Considering Volume: A surge in trading volume during the breakout often confirms the strength of the move. Low volume breakouts may be false signals.
- Paying Attention to Support and Resistance Levels: Identify key support and resistance levels. A breakout above a resistance level following a Bollinger Squeeze is a strong bullish signal, while a breakdown below a support level is a bearish signal.
Trading Strategies Using the Bollinger Squeeze
The Bollinger Squeeze can be incorporated into various trading strategies. Here are a few examples:
Breakout Trading
This is the most common strategy. Traders wait for the price to break above the upper band or below the lower band after a Bollinger Squeeze. A breakout above the upper band is considered a bullish signal, and traders would enter a long position. Conversely, a breakout below the lower band is a bearish signal, and traders would enter a short position. It’s essential to use stop-loss orders to manage risk in case of a false breakout. [See also: Understanding Stop-Loss Orders]
Range Trading
During the Bollinger Squeeze itself, before the breakout occurs, traders can use a range trading strategy. This involves buying near the lower band and selling near the upper band, profiting from the small price fluctuations within the constricted range. This strategy is riskier and requires careful monitoring, as the breakout can occur unexpectedly. [See also: Range Trading Strategies for Beginners]
Combining with Trend Following
The Bollinger Squeeze can be used to identify potential entry points in a trending market. For example, if the market is in an uptrend, a Bollinger Squeeze followed by a breakout above the upper band could provide a good entry point to join the existing trend. [See also: Identifying Market Trends]
Advantages and Limitations of the Bollinger Squeeze
Like any technical indicator, the Bollinger Squeeze has its advantages and limitations:
Advantages:
- Identifies Potential Breakouts: The primary advantage is its ability to identify periods of low volatility that often precede significant price movements.
- Objective Measurement of Volatility: Bollinger Bands provide an objective way to measure market volatility.
- Versatile Application: Can be used in various trading strategies and timeframes.
Limitations:
- Doesn’t Predict Direction: The Bollinger Squeeze only indicates a potential breakout, not the direction of the breakout.
- False Signals: Can generate false signals, especially in choppy or sideways markets.
- Lagging Indicator: As a lagging indicator, it confirms past price action rather than predicting future price action.
Risk Management
Effective risk management is crucial when trading the Bollinger Squeeze. Always use stop-loss orders to limit potential losses in case of a false breakout. The placement of the stop-loss order depends on the trading strategy and risk tolerance. For breakout trading, a stop-loss order can be placed just below the lower band for long positions and just above the upper band for short positions. [See also: Essential Risk Management Techniques]
Position sizing is also important. Don’t risk more than a small percentage of your trading capital on any single trade. Diversification can also help reduce risk.
Conclusion
The Bollinger Squeeze is a valuable tool for traders seeking to identify potential trading opportunities. By understanding its components, interpretation, and limitations, traders can effectively incorporate it into their trading strategies. However, it’s essential to remember that the Bollinger Squeeze is not a standalone indicator and should be used in conjunction with other technical analysis techniques and risk management strategies. Mastering the Bollinger Squeeze can significantly enhance a trader’s ability to anticipate market movements and improve profitability, but consistent practice and disciplined risk management are key to long-term success. The Bollinger Squeeze, when used correctly, provides insights into market volatility and potential breakout points. The Bollinger Squeeze is a powerful tool for any serious trader willing to learn its nuances. The Bollinger Squeeze can be a game-changer for your trading strategy. The Bollinger Squeeze truly shines when combined with other indicators. The Bollinger Squeeze is a must-have in your trading toolkit. The Bollinger Squeeze offers a unique perspective on market dynamics. The Bollinger Squeeze is your gateway to understanding market volatility. Understanding the Bollinger Squeeze empowers you to make informed trading decisions. The Bollinger Squeeze provides valuable insights into potential market breakouts. The Bollinger Squeeze is a key component of technical analysis.
