Decoding the Stocks Hammer Candlestick: A Trader’s Guide
In the dynamic world of stock trading, understanding chart patterns is crucial for making informed decisions. Among these patterns, the hammer candlestick stands out as a potentially powerful signal of a bullish reversal. This article delves into the intricacies of the stocks hammer candlestick, exploring its characteristics, interpretation, and limitations, providing traders with a comprehensive guide to leverage this valuable tool.
What is a Hammer Candlestick?
The stocks hammer candlestick is a single-period price pattern that appears on a stock chart. It’s characterized by a small body at the upper end of the trading range and a long lower shadow (or wick) that is at least twice the length of the body. Importantly, the color of the body (whether it’s bullish green or bearish red) isn’t as important as the overall shape. A hammer suggests that during the period, sellers initially drove the price significantly lower, but buyers then stepped in and pushed the price back up to close near the opening price.
Essentially, the stocks hammer candlestick represents a rejection of lower prices and a potential shift in market sentiment from bearish to bullish. It’s a visual representation of a battle between buyers and sellers, where the buyers ultimately gain the upper hand.
Key Characteristics of a Hammer Candlestick
- Small Body: The real body (the distance between the open and close) is relatively small.
- Long Lower Shadow: The lower shadow is significantly longer, usually at least twice the length of the body.
- Little or No Upper Shadow: Ideally, the hammer has a very small or non-existent upper shadow.
- Location: The hammer is most significant when it appears after a downtrend.
Interpreting the Hammer Candlestick
The stocks hammer candlestick is a bullish reversal pattern, but it shouldn’t be interpreted in isolation. Here’s how to properly analyze it:
Confirmation is Key
A hammer signal is stronger when it’s confirmed by subsequent price action. This confirmation typically comes in the form of a bullish candlestick (e.g., a green candle) on the next trading day that closes above the close of the hammer. Without confirmation, the hammer is just a potential signal.
Consider the Volume
Volume can add weight to the hammer signal. Higher-than-average volume on the day the hammer forms, and especially on the confirmation day, suggests stronger buying pressure and a higher probability of a bullish reversal. Low volume, conversely, weakens the signal.
Look at the Broader Context
The stocks hammer candlestick should be analyzed in the context of the overall trend and support/resistance levels. A hammer that forms at a key support level after a prolonged downtrend is generally a stronger signal than one that forms in the middle of a trading range. [See also: Identifying Support and Resistance Levels]
The Inverted Hammer
The inverted hammer is a similar pattern, but it has a long upper shadow and a small body at the lower end of the trading range. It also signals a potential bullish reversal, but it requires the same confirmation as the standard hammer.
Examples of Stocks Hammer Candlestick Patterns
Imagine a stock has been in a steady downtrend for several weeks. One day, the stock opens at $50, falls to $45 during the day, but then rallies to close near $49. The candlestick that forms would have a small body near the top and a long lower shadow. If the next day the stock closes above $49, this would confirm the hammer and suggest a potential upward trend.
Another example: A stock trades sideways for a few days, then experiences a sharp selloff during a single trading session. However, buyers step in late in the day, pushing the price back up to close near the opening price. This forms a stocks hammer candlestick, indicating that the selling pressure may be exhausted and a reversal is possible. Again, confirmation is crucial.
Limitations of the Hammer Candlestick
While the stocks hammer candlestick can be a valuable tool, it’s not foolproof. Here are some limitations to keep in mind:
- False Signals: Like all technical indicators, hammers can generate false signals. The price may not always reverse after a hammer forms.
- Subjectivity: Interpreting candlestick patterns can be somewhat subjective. What one trader considers a valid hammer, another might not.
- Lagging Indicator: Candlestick patterns are lagging indicators, meaning they reflect past price action rather than predicting future movements.
- Market Conditions: The effectiveness of the hammer can vary depending on overall market conditions. In highly volatile markets, hammer signals may be less reliable.
Trading Strategies Using the Hammer Candlestick
Here are some potential trading strategies that incorporate the stocks hammer candlestick:
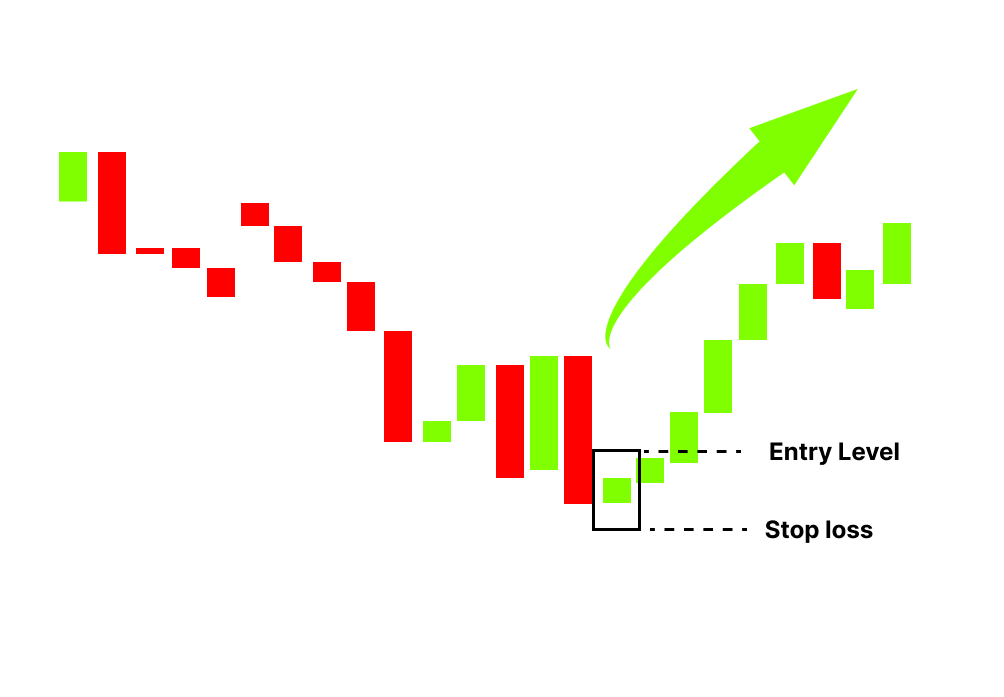
Entry Points
Traders often look to enter long positions on the confirmation day following a hammer. A stop-loss order can be placed below the low of the hammer to manage risk.
Combining with Other Indicators
To improve the accuracy of hammer signals, traders often combine them with other technical indicators, such as moving averages, Relative Strength Index (RSI), or Moving Average Convergence Divergence (MACD). [See also: Using RSI to Identify Overbought and Oversold Stocks]
Target Setting
Potential profit targets can be set based on resistance levels or Fibonacci retracement levels. It’s important to have a clear exit strategy before entering a trade.
The Psychology Behind the Hammer
Understanding the psychology behind the stocks hammer candlestick can provide deeper insights into its significance. The long lower shadow represents a period of intense selling pressure, which may be driven by fear or negative news. However, the subsequent rally back to near the opening price indicates that buyers stepped in and absorbed the selling pressure, suggesting a shift in sentiment. This shift from bearish to bullish is what makes the hammer a potential reversal signal.
Hammer Candlesticks in Different Timeframes
The stocks hammer candlestick pattern can be observed on various timeframes, from intraday charts (e.g., 5-minute, 15-minute) to daily, weekly, and monthly charts. Generally, hammer patterns on longer timeframes are considered more reliable than those on shorter timeframes, as they represent more significant price movements.
Beyond the Basics: Advanced Hammer Analysis
Experienced traders may use advanced techniques to analyze stocks hammer candlestick patterns. This could involve looking at the size of the body relative to the lower shadow, the overall volume pattern, and the proximity of the hammer to key support and resistance levels. They may also consider the context of the broader market and economic news to assess the likelihood of a successful reversal.
Conclusion
The stocks hammer candlestick is a valuable tool for traders seeking to identify potential bullish reversals. By understanding its characteristics, interpretation, and limitations, traders can incorporate this pattern into their trading strategies and improve their decision-making. Remember that confirmation is crucial, and the hammer should always be analyzed in the context of the overall market. While not a guaranteed predictor of future price movements, the hammer, when used wisely, can provide valuable insights into market sentiment and potential trading opportunities.
