Decoding the Stock Hammer Candle: A Comprehensive Guide for Traders
The stock market is a complex arena, filled with patterns and indicators that can help traders make informed decisions. Among these, the stock hammer candle stands out as a potent signal, often indicating a potential bullish reversal. Understanding the nuances of the stock hammer candle is crucial for any trader looking to improve their technical analysis skills. This guide will delve into what the stock hammer candle is, how to identify it, its significance, and how to use it effectively in your trading strategy.
What is a Stock Hammer Candle?
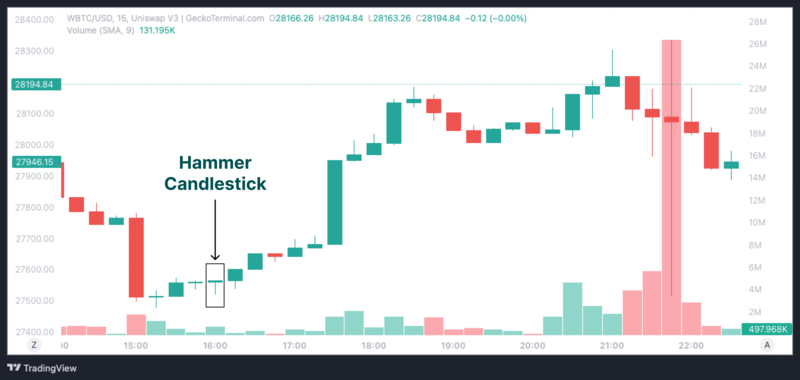
A stock hammer candle is a single candlestick pattern that appears on a price chart, signaling a potential reversal from a downtrend to an uptrend. It is characterized by a small body (either bullish or bearish), a long lower shadow (or wick), and a short or nonexistent upper shadow. The long lower shadow indicates that during the period, sellers initially drove the price down significantly, but buyers then stepped in and pushed the price back up, closing near the opening price.
The key characteristics of a stock hammer candle include:
- Small Body: The real body (the difference between the open and close price) is relatively small.
- Long Lower Shadow: The lower shadow should be at least twice the length of the real body. This indicates strong buying pressure.
- Short or Nonexistent Upper Shadow: The upper shadow is either very short or completely absent.
Identifying the Stock Hammer Candle
Identifying a stock hammer candle requires careful observation of candlestick charts. Here’s a step-by-step guide:
- Look for a Downtrend: The stock hammer candle is only significant if it appears after a period of price decline.
- Observe the Candlestick: Identify a candlestick with a small body, a long lower shadow (at least twice the length of the body), and a short or nonexistent upper shadow.
- Consider the Color: While not essential, a bullish (green or white) stock hammer candle is generally considered a stronger signal than a bearish (red or black) one. A bullish hammer indicates that the closing price was higher than the opening price, reinforcing the bullish sentiment.
- Confirmation: Wait for confirmation in the subsequent candles. This often comes in the form of a bullish candle that closes above the high of the stock hammer candle.
The Psychology Behind the Stock Hammer Candle
Understanding the psychology behind the stock hammer candle is essential for interpreting its significance. The long lower shadow represents a battle between buyers and sellers. Initially, sellers were in control, pushing the price down to a new low. However, buyers then intervened, driving the price back up towards the opening price. This signifies a shift in momentum and suggests that buyers are gaining strength. The small body indicates that neither buyers nor sellers were able to maintain control, resulting in a near-equal closing price. This indecision, combined with the strong buying pressure shown by the long lower shadow, often signals a potential reversal of the downtrend.
Distinguishing the Hammer from Other Candlestick Patterns
It’s important to distinguish the stock hammer candle from other candlestick patterns, such as the Hanging Man and the Inverted Hammer. The Hanging Man looks identical to the Hammer but appears at the end of an uptrend, signaling a potential bearish reversal. The Inverted Hammer, on the other hand, has a long upper shadow and a small lower shadow and can signal a potential bullish reversal after a downtrend.
Here’s a quick comparison:
- Hammer: Small body, long lower shadow, appears after a downtrend, signals bullish reversal.
- Hanging Man: Small body, long lower shadow, appears after an uptrend, signals bearish reversal.
- Inverted Hammer: Small body, long upper shadow, appears after a downtrend, signals bullish reversal.
- Shooting Star: Small body, long upper shadow, appears after an uptrend, signals bearish reversal.
How to Trade with the Stock Hammer Candle
Trading with the stock hammer candle involves several steps to ensure a higher probability of success:
- Identify the Hammer: As discussed earlier, look for the specific characteristics of a stock hammer candle after a downtrend.
- Confirmation: Do not act solely on the appearance of the hammer. Wait for confirmation in the form of a bullish candle that closes above the high of the hammer. This confirms that buyers are indeed taking control.
- Set a Stop-Loss: Place a stop-loss order below the low of the stock hammer candle. This helps to limit potential losses if the reversal does not occur.
- Determine a Target Price: Use other technical indicators, such as resistance levels or Fibonacci retracements, to determine a target price for your trade.
- Manage Risk: Always manage your risk by only risking a small percentage of your trading capital on any single trade.
Example Trade Setup with a Stock Hammer Candle
Let’s say you are analyzing the chart of XYZ stock and notice a clear downtrend. A stock hammer candle appears, with a small bullish body and a long lower shadow. The next candle closes above the high of the hammer, confirming the bullish reversal. You decide to enter a long position (buy) at the close of the confirming candle. You set a stop-loss order just below the low of the stock hammer candle and determine a target price based on a nearby resistance level. As the price moves towards your target, you can adjust your stop-loss to lock in profits. This is a typical example of how to trade with the stock hammer candle.
The Importance of Volume
Volume plays a crucial role in confirming the validity of a stock hammer candle. Ideally, the stock hammer candle should be accompanied by above-average trading volume. This indicates that there is strong buying interest and that the reversal is more likely to be sustained. Low volume, on the other hand, may suggest that the reversal is not as strong and that the price may continue to decline.
Combining the Stock Hammer Candle with Other Indicators
To increase the reliability of the stock hammer candle, it’s often beneficial to combine it with other technical indicators. Some popular combinations include:
- Moving Averages: If the stock hammer candle appears near a key moving average, such as the 50-day or 200-day moving average, it can provide additional confirmation of the reversal.
- Relative Strength Index (RSI): If the RSI is oversold (below 30) when the stock hammer candle appears, it suggests that the stock is undervalued and that a reversal is more likely.
- Fibonacci Retracements: If the stock hammer candle appears near a Fibonacci retracement level, it can act as a support level and increase the probability of a successful trade.
By using these indicators in conjunction with the stock hammer candle, traders can gain a more comprehensive view of the market and make more informed decisions.
Limitations of the Stock Hammer Candle
While the stock hammer candle can be a valuable tool, it’s important to be aware of its limitations. Like all technical indicators, it is not foolproof and can generate false signals. The stock hammer candle is most effective when used in conjunction with other forms of analysis and confirmation. Relying solely on the stock hammer candle without considering other factors can lead to poor trading decisions.
Real-World Examples of the Stock Hammer Candle
Analyzing historical charts can provide valuable insights into how the stock hammer candle has performed in the past. Look for instances where the stock hammer candle correctly predicted a bullish reversal and instances where it failed. Understanding the context in which the stock hammer candle appeared can help you better assess its reliability in future trading scenarios.
The Role of Market Context
The overall market context plays a significant role in the effectiveness of the stock hammer candle. A stock hammer candle that appears during a period of strong overall market bullishness is more likely to be successful than one that appears during a period of market uncertainty. Consider the broader market trends and news events that may be influencing the stock price before making a trading decision based on the stock hammer candle.
Advanced Strategies with the Stock Hammer Candle
Experienced traders may develop advanced strategies that incorporate the stock hammer candle. These strategies might involve using more complex indicators, such as Elliott Wave theory or Ichimoku Cloud, to confirm the reversal. They might also involve using options strategies to leverage the potential upside of the reversal while limiting the downside risk. [See also: Options Trading Strategies for Beginners]
Common Mistakes to Avoid
Several common mistakes can undermine the effectiveness of trading with the stock hammer candle:
- Ignoring Confirmation: Failing to wait for confirmation before entering a trade is a common mistake. Always wait for a bullish candle to close above the high of the hammer.
- Setting Stop-Losses Incorrectly: Placing stop-losses too close to the entry price can result in being stopped out prematurely. Place stop-losses below the low of the stock hammer candle.
- Over-Leveraging: Using too much leverage can amplify losses if the reversal does not occur. Always manage your risk and use appropriate position sizing.
- Ignoring Volume: Neglecting to consider volume can lead to false signals. Look for above-average volume to confirm the reversal.
- Trading Against the Trend: Trying to trade against the overall market trend can be risky. The stock hammer candle is more effective when it aligns with the broader market sentiment.
Conclusion
The stock hammer candle is a powerful tool for identifying potential bullish reversals in the stock market. By understanding its characteristics, psychology, and limitations, traders can use it effectively in their trading strategies. However, it’s crucial to remember that the stock hammer candle is just one piece of the puzzle and should be used in conjunction with other forms of analysis and confirmation. With careful observation, patience, and a solid risk management plan, the stock hammer candle can be a valuable asset in any trader’s toolkit. The stock hammer candle, when properly understood and applied, can significantly enhance your trading success. Always remember to practice responsible trading and continuously refine your skills to adapt to the ever-changing market dynamics. The power of the stock hammer candle lies in its ability to signal potential shifts in market sentiment, providing astute traders with opportunities to capitalize on emerging trends. Embrace the learning process, stay informed, and let the stock hammer candle guide you towards more informed and profitable trading decisions. As you become more proficient in recognizing and interpreting the stock hammer candle, you’ll gain a deeper understanding of market dynamics and improve your overall trading performance. The stock hammer candle is a testament to the power of technical analysis and its ability to provide valuable insights into market behavior. Remember to always prioritize risk management and continuous learning to maximize your success in the dynamic world of stock trading. Mastering the art of identifying and trading the stock hammer candle is a journey that requires dedication, patience, and a willingness to adapt to evolving market conditions. Embrace the challenge, stay focused on your goals, and let the stock hammer candle be a valuable tool in your arsenal. The stock hammer candle can be a reliable indicator, but remember to always confirm the signal with other indicators and price action. [See also: Advanced Candlestick Patterns].
