Decoding the Stocks Hammer Candlestick: A Comprehensive Guide for Traders
In the dynamic world of stock trading, understanding candlestick patterns is crucial for making informed decisions. Among these patterns, the stocks hammer candlestick stands out as a potential indicator of a bullish reversal. This article provides a comprehensive guide to understanding the hammer candlestick, its characteristics, how to identify it, and how to use it effectively in your trading strategy. We’ll delve into the nuances of this pattern, offering insights that can help both novice and experienced traders navigate the complexities of the stock market.
What is a Hammer Candlestick?
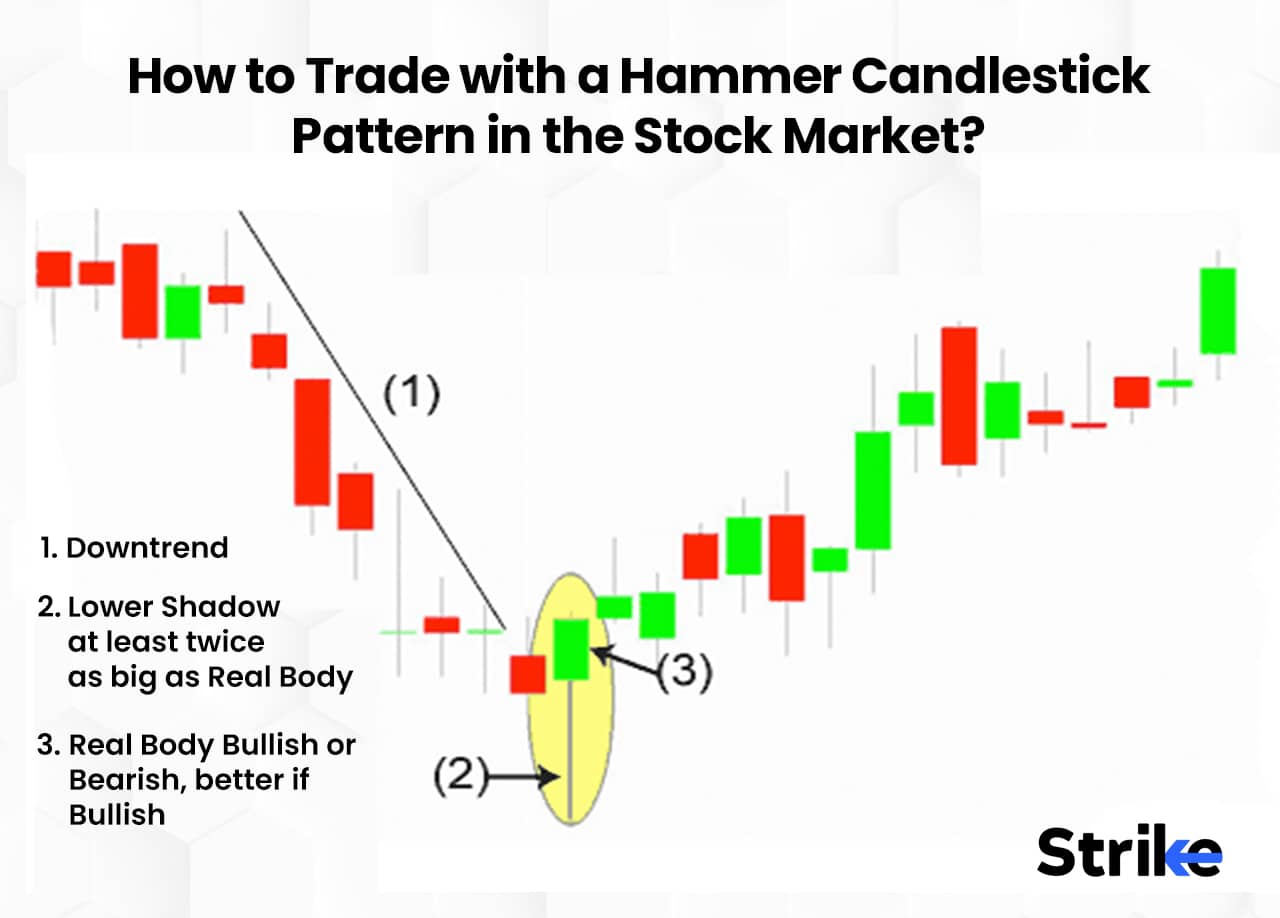
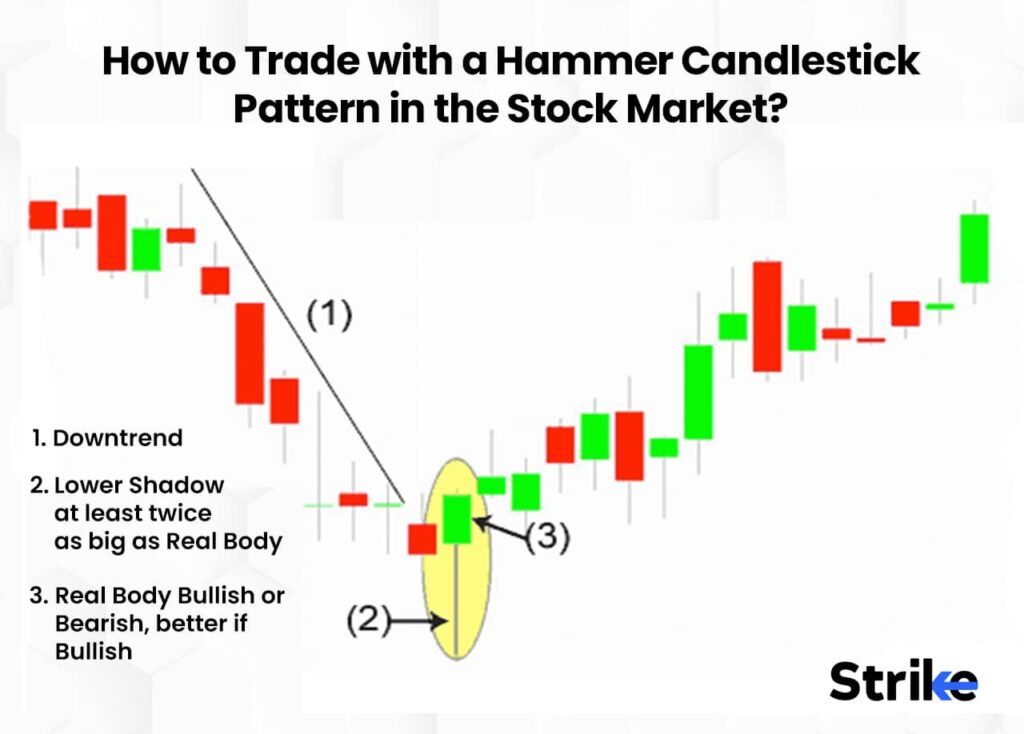
The hammer candlestick is a single-candlestick pattern that signals a potential bottom reversal in a downtrend. It’s characterized by a small real body (either bullish or bearish), a long lower shadow (also known as a wick), and a short or absent upper shadow. The long lower shadow indicates that during the period, sellers initially drove the price down significantly. However, buyers then stepped in and pushed the price back up, closing near the opening price. This suggests that the downtrend may be losing momentum, and buyers are starting to gain control.
Key Characteristics of a Hammer Candlestick
- Small Real Body: The body of the candlestick, representing the difference between the open and close prices, should be relatively small.
- Long Lower Shadow: The lower shadow should be at least twice the length of the real body. This is the most critical characteristic.
- Short or Absent Upper Shadow: Ideally, the upper shadow should be very short or non-existent. This reinforces the bullish reversal signal.
- Prior Downtrend: The hammer candlestick is only valid if it appears after a period of declining prices.
How to Identify a Hammer Candlestick
Identifying a stocks hammer candlestick requires careful observation of price charts. Look for the following:
- Existing Downtrend: Confirm that the price has been in a downtrend before the appearance of the potential hammer.
- Candlestick Shape: Look for a candlestick with a small body, a long lower shadow (at least twice the length of the body), and a short or absent upper shadow.
- Color of the Body: The color of the body (bullish or bearish) is less important than the shape. A bullish hammer may provide a slightly stronger signal, but a bearish hammer can still be valid.
- Confirmation: Wait for confirmation in the subsequent trading periods. This usually comes in the form of a bullish candlestick following the hammer, or the price moving above the high of the hammer candlestick.
The Psychology Behind the Hammer Candlestick
The stocks hammer candlestick reflects a significant shift in market sentiment. During the trading period, sellers were initially dominant, pushing the price down to a new low. However, buyers then intervened, aggressively buying up shares and driving the price back up towards the opening price. This indicates that buyers are starting to overpower sellers and that the downtrend may be exhausting itself. The long lower shadow represents the extent of the sellers’ attempt to push the price lower, while the small body signifies the buyers’ success in reversing that attempt.
Trading Strategies Using the Hammer Candlestick
The hammer candlestick can be a valuable tool for identifying potential buying opportunities. Here are some trading strategies to consider:
Entry Point
A common approach is to enter a long position after the price moves above the high of the hammer candlestick. This confirms that the bullish momentum is continuing. Some traders may choose to enter a position immediately after the hammer forms, but this is a more aggressive approach and carries higher risk.
Stop-Loss Placement
A prudent stop-loss order is essential to manage risk. A common placement is below the low of the hammer candlestick. This protects against the possibility of the downtrend resuming.
Profit Target
Determining a profit target depends on your risk tolerance and trading style. Some traders may aim for a specific percentage gain, while others may use technical indicators or chart patterns to identify potential resistance levels.
Confirmation is Key
It’s crucial to wait for confirmation before entering a trade based on the hammer candlestick. This confirmation can come in the form of a bullish candlestick following the hammer, increased trading volume, or a break above a key resistance level. Without confirmation, the hammer may simply be a temporary pause in the downtrend.
Examples of Hammer Candlestick in Stocks
Let’s consider a hypothetical example. Suppose the stock of Company X has been in a downtrend for several weeks, falling from $50 to $40. One day, a hammer candlestick appears on the chart. The candlestick has a small body, a long lower shadow extending down to $38, and a short upper shadow. The next day, the stock opens higher and continues to rise, breaking above the high of the hammer at $41. This confirms the bullish reversal signal, and a trader might enter a long position with a stop-loss order placed below $38.
Another example might be found in the tech sector. Imagine Company Y, a technology firm, experiences a sell-off after disappointing earnings. The stock price declines steadily. Then, a stocks hammer candlestick forms, showing strong buying pressure at a lower price point. The subsequent days see a rebound in the stock price, confirming the pattern and presenting a potential buying opportunity. [See also: Analyzing Candlestick Patterns for Stock Trading]
Limitations of the Hammer Candlestick
While the hammer candlestick can be a useful tool, it’s important to be aware of its limitations:
- False Signals: Like all technical indicators, the hammer candlestick can generate false signals. It’s not a foolproof predictor of price movements.
- Context Matters: The effectiveness of the hammer candlestick depends on the overall market context. It’s more reliable when it appears in conjunction with other bullish signals or at a key support level.
- Subjectivity: Identifying a hammer candlestick can be subjective. Different traders may interpret the pattern differently.
The Inverted Hammer Candlestick
The inverted hammer is another single-candlestick pattern that can signal a potential bullish reversal, similar to the stocks hammer candlestick. However, instead of having a long lower shadow, the inverted hammer has a long upper shadow and a short or absent lower shadow. It appears after a downtrend and suggests that buyers are starting to gain control, potentially leading to a price reversal.
The inverted hammer’s long upper shadow indicates that buyers attempted to push the price higher during the trading period, but sellers ultimately pushed it back down towards the opening price. However, the fact that buyers were able to push the price higher at all suggests that the downtrend may be losing momentum.
Differentiating the Hammer from the Hanging Man
It is crucial not to confuse the stocks hammer candlestick with the hanging man pattern. While they have the same shape, their implications are different due to their placement within a trend. The hammer appears in a downtrend and signals a potential bullish reversal, while the hanging man appears in an uptrend and signals a potential bearish reversal. The hanging man suggests that despite the overall bullish trend, sellers are starting to exert pressure, and the uptrend may be nearing its end. [See also: Understanding Bearish Candlestick Patterns]
Combining Hammer Candlesticks with Other Indicators
To increase the reliability of the stocks hammer candlestick signal, it’s often beneficial to combine it with other technical indicators. For example, you could look for a hammer candlestick that appears near a key support level or coincides with an oversold reading on the Relative Strength Index (RSI). Combining multiple indicators can help to filter out false signals and increase the probability of a successful trade.
Other indicators to consider include:
- Moving Averages: A hammer candlestick that forms near a moving average can provide additional confirmation of a potential reversal.
- Volume: Increased trading volume during the formation of the hammer can strengthen the signal.
- Fibonacci Levels: A hammer candlestick that forms near a Fibonacci retracement level can indicate a potential turning point.
Conclusion
The stocks hammer candlestick is a valuable tool for traders looking to identify potential bullish reversals in a downtrend. By understanding its characteristics, how to identify it, and how to use it in conjunction with other indicators, traders can improve their decision-making and increase their chances of success in the stock market. However, it’s important to remember that the hammer candlestick is not a foolproof indicator, and risk management is essential. Always use stop-loss orders and trade responsibly.
By carefully analyzing candlestick patterns like the stocks hammer candlestick and integrating them into a comprehensive trading strategy, investors can gain a significant edge in navigating the complexities of the financial markets.
