Parabolic Meaning in Stocks: Understanding Exponential Growth
In the dynamic world of stock trading and investment, certain patterns and trends can signal significant shifts in market sentiment and potential opportunities. One such pattern is the parabolic movement. Understanding the parabolic meaning in stocks is crucial for investors and traders alike, as it can indicate periods of rapid growth or decline. This article delves into the concept of parabolic movements in the stock market, exploring its characteristics, implications, and strategies for navigating this volatile phenomenon.
What is a Parabolic Move in Stocks?
A parabolic move in stocks refers to a sharp, almost vertical increase or decrease in a stock’s price over a relatively short period. This type of movement resembles the shape of a parabola on a graph, hence the name. Parabolic movements are often driven by intense buying or selling pressure, fueled by factors such as positive or negative news, market hype, or speculative trading.
The parabolic meaning in stocks extends beyond just identifying the shape on a chart. It signifies a period of heightened volatility and potential instability. While a parabolic rise can generate substantial profits for early investors, it also carries a significant risk of a sharp correction or reversal. Conversely, a parabolic decline can lead to substantial losses for those holding the stock.
Characteristics of Parabolic Movements
Several key characteristics define parabolic movements in the stock market:
- Sharp Price Increase or Decrease: The defining feature of a parabolic move is the rapid and substantial change in price.
- High Volume: Parabolic movements are typically accompanied by high trading volume, indicating strong market participation.
- Short Timeframe: These movements tend to occur over a relatively short period, ranging from a few days to a few weeks.
- Unsustainable Trajectory: Due to their extreme nature, parabolic movements are generally unsustainable and often followed by a correction or reversal.
- Emotional Trading: Parabolic moves are often driven by emotional trading, such as fear of missing out (FOMO) during a rise or panic selling during a decline.
Factors Contributing to Parabolic Movements
Several factors can contribute to the development of parabolic movements in stocks:
- Positive or Negative News: A major announcement, such as positive earnings reports, FDA approval for a drug, or a groundbreaking technological innovation, can trigger a surge in buying pressure. Conversely, negative news, such as disappointing earnings, product recalls, or regulatory setbacks, can lead to a sharp sell-off.
- Market Hype: Sometimes, a stock can become the subject of intense hype and speculation, driven by social media, online forums, or investment newsletters. This can lead to a self-fulfilling prophecy, where rising prices attract more buyers, further fueling the parabolic move.
- Short Squeezes: A short squeeze occurs when a heavily shorted stock experiences a sudden price increase, forcing short sellers to cover their positions by buying back the stock. This can create a feedback loop, where the buying pressure from short covering further drives up the price, leading to a parabolic rise.
- Low Float Stocks: Stocks with a small number of shares available for trading (low float) are more susceptible to parabolic movements. A relatively small increase in buying pressure can have a significant impact on the price, leading to a rapid and unsustainable rise.
Identifying Parabolic Patterns
Identifying potential parabolic patterns requires careful observation and analysis of stock charts. Traders and investors often use technical indicators to help identify these patterns:
- Moving Averages: Observing how the stock price interacts with moving averages can provide clues about the strength and sustainability of the trend. A stock trading significantly above its moving averages may be in a parabolic phase.
- Relative Strength Index (RSI): The RSI measures the magnitude of recent price changes to evaluate overbought or oversold conditions. An RSI value above 70 typically indicates that a stock is overbought and may be due for a correction.
- Volume Analysis: Monitoring trading volume can provide valuable insights into the strength of a parabolic move. High volume during a price increase suggests strong buying pressure, while declining volume may indicate a weakening trend.
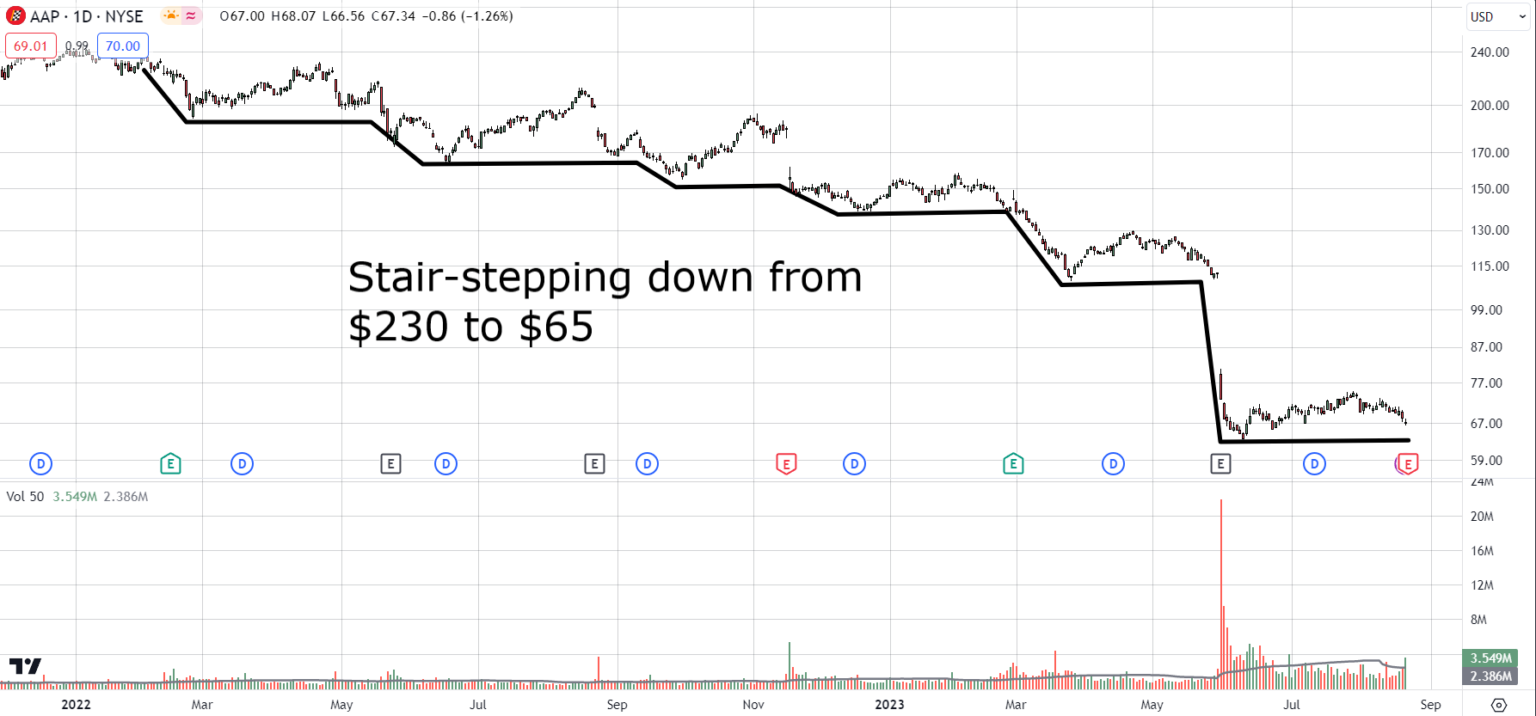
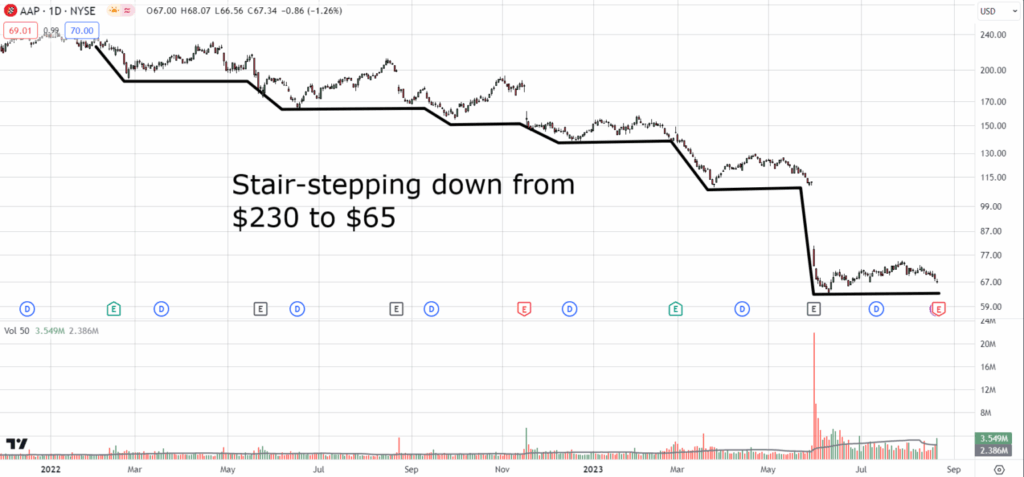
- Chart Patterns: Look for chart patterns that suggest a rapid acceleration in price, such as steep uptrends or downtrends with minimal pullbacks.
Strategies for Trading Parabolic Stocks
Trading parabolic stocks can be both rewarding and risky. Here are some strategies to consider:
For Parabolic Rises:
- Early Entry: The most profitable strategy is to identify a potential parabolic move early on and enter the trade before the price accelerates too rapidly. This requires careful analysis and a degree of risk tolerance.
- Trailing Stop-Loss: Once in a trade, use a trailing stop-loss order to protect your profits and limit your potential losses. A trailing stop-loss automatically adjusts as the price moves in your favor, locking in gains while providing downside protection.
- Profit Taking: It’s crucial to have a profit target in mind and to take profits as the stock approaches that target. Greed can often lead to missed opportunities and potential losses.
- Be Aware of the Risks: Understand that parabolic rises are unsustainable and that a correction or reversal is likely to occur. Don’t get caught up in the hype and always manage your risk carefully.
For Parabolic Declines:
- Avoid Catching a Falling Knife: It’s generally advisable to avoid trying to buy a stock that is in a parabolic decline. Trying to time the bottom can be extremely risky, as the price may continue to fall further than you expect.
- Consider Shorting (with Caution): Experienced traders may consider shorting a stock that is in a parabolic decline, but this strategy carries significant risk and should only be attempted by those with a thorough understanding of short selling and risk management.
- Wait for Stabilization: It’s often best to wait for the stock to stabilize and show signs of a potential bottom before considering a long position. Look for indicators such as consolidation patterns, increased volume on up days, and positive news catalysts.
Risks Associated with Parabolic Movements
Trading parabolic stocks involves significant risks that investors should be aware of:
- Sudden Reversals: Parabolic movements are often followed by sharp corrections or reversals, which can lead to substantial losses for those holding the stock.
- Volatility: Parabolic stocks are highly volatile, making them susceptible to large price swings and unexpected events.
- Emotional Trading: The hype and excitement surrounding parabolic stocks can lead to emotional trading decisions, which can cloud judgment and increase the risk of losses.
- Lack of Fundamentals: Parabolic movements are often driven by speculation rather than fundamental factors, making them difficult to predict and sustain.
Examples of Parabolic Stocks
Throughout history, there have been numerous examples of stocks that have experienced parabolic movements. Some notable examples include:
- GameStop (GME): In early 2021, GameStop experienced a massive short squeeze that led to a parabolic rise in its stock price, driven by retail investors coordinating on social media platforms.
- Tesla (TSLA): Tesla’s stock price has experienced several periods of parabolic growth, driven by its innovative technology, strong brand recognition, and increasing demand for electric vehicles.
- Bitcoin (BTC): While not a stock, Bitcoin has also experienced parabolic movements, driven by increasing adoption, institutional interest, and speculative trading.
The Importance of Risk Management
When trading parabolic stocks, risk management is paramount. Implement the following risk management strategies:
- Position Sizing: Limit the amount of capital you allocate to any single parabolic stock. Avoid putting all your eggs in one basket.
- Stop-Loss Orders: Always use stop-loss orders to limit your potential losses. A stop-loss order automatically sells your shares if the price falls below a certain level.
- Diversification: Diversify your portfolio across different sectors and asset classes to reduce your overall risk exposure.
- Emotional Control: Avoid making impulsive decisions based on fear or greed. Stick to your trading plan and manage your emotions effectively.
Conclusion
Understanding the parabolic meaning in stocks is essential for navigating the complexities of the stock market. Parabolic movements can present both opportunities and risks, and it’s crucial to approach them with caution and a well-defined trading strategy. By identifying potential parabolic patterns, implementing effective risk management techniques, and avoiding emotional trading decisions, investors and traders can increase their chances of success in this volatile environment. Remember that a parabolic rise is often followed by a parabolic fall, so always be prepared for a potential correction. The key to successful trading of parabolic stocks lies in understanding the parabolic meaning and managing risk effectively. Don’t let the allure of quick profits cloud your judgment. Always prioritize capital preservation and make informed decisions based on thorough analysis and research. The parabolic nature of these movements means that they are often unsustainable, so it’s important to be prepared for a potential reversal. Recognizing the parabolic shape on a stock chart is just the first step; understanding the underlying dynamics is what truly matters. A parabolic climb can be exhilarating, but it’s important to remember that what goes up must come down. Therefore, always approach parabolic stocks with a healthy dose of skepticism and a well-defined exit strategy. The parabolic meaning encapsulates both the potential for profit and the risk of significant loss. Finally, mastering the art of trading parabolic stocks requires a combination of technical analysis, risk management, and emotional discipline. The parabolic pattern, when correctly identified, can be a powerful tool, but it’s essential to wield it responsibly. Remember, the parabolic meaning in stocks is a double-edged sword, and only those who understand its nuances can truly harness its power. Always be mindful of the parabolic trajectory and adjust your strategy accordingly. A parabolic move is a testament to the market’s ability to surprise and challenge even the most seasoned investors.
[See also: Understanding Stock Market Volatility]
[See also: Risk Management Strategies for Traders]
[See also: Technical Analysis for Beginners]
