Decoding ABC Pattern Examples: A Comprehensive Guide for Traders
In the dynamic world of trading, identifying patterns is crucial for making informed decisions. One such pattern that traders frequently encounter is the ABC pattern. This pattern, characterized by its distinct three-wave structure, offers valuable insights into potential market reversals and continuations. Understanding ABC pattern examples is fundamental for any trader looking to enhance their technical analysis skills. This guide provides a comprehensive overview of the ABC pattern, exploring its formation, variations, and practical applications.
Understanding the ABC Pattern
The ABC pattern is a corrective pattern that occurs after an impulsive move in the market. It’s a three-wave formation labeled as A, B, and C, each representing a specific phase of the correction. The pattern is used to identify potential entry and exit points in the market. Recognizing ABC pattern examples can give traders an edge in predicting future price movements.
The Anatomy of an ABC Pattern
- Wave A: This is the initial corrective wave that moves against the preceding trend. It often retraces a portion of the impulsive move.
- Wave B: This is a counter-trend wave that retraces a portion of Wave A. It’s crucial to note that Wave B typically does not exceed the starting point of Wave A.
- Wave C: This is the final wave of the pattern, moving in the same direction as Wave A. It often extends beyond the end of Wave A, indicating a potential continuation of the original trend.
Types of ABC Patterns
While the basic structure remains the same, ABC patterns can manifest in different forms, each with its own implications for trading strategies. Understanding these variations is key to accurately interpreting market signals.
Zigzag Pattern
The zigzag pattern is a sharp, corrective move that often retraces a significant portion of the preceding trend. It’s characterized by strong momentum in both Wave A and Wave C. In zigzag ABC pattern examples, Wave B typically retraces a small percentage of Wave A, indicating a strong underlying trend.
Flat Pattern
The flat pattern is a sideways correction where Wave B retraces nearly all of Wave A. This pattern indicates a strong underlying trend and suggests that the market is consolidating before continuing in the same direction. Identifying flat ABC pattern examples can signal potential breakout opportunities.
Triangle Pattern
Triangle patterns are characterized by converging trendlines, indicating a period of consolidation. While not a classic ABC pattern in the traditional sense, they can be viewed as complex corrections that often precede a strong breakout. Recognizing these patterns requires careful analysis of price action and volume.
Identifying ABC Pattern Examples in Real-World Trading
Now that we’ve covered the theoretical aspects, let’s delve into practical ABC pattern examples that traders can use to identify and capitalize on these patterns in the market.
Example 1: Uptrend Continuation
Imagine a stock that has been trending upward for several weeks. Suddenly, the stock begins to retrace, forming Wave A. This is followed by a counter-trend move, forming Wave B. Finally, the stock resumes its upward trajectory, forming Wave C, which breaks above the high of Wave A. This ABC pattern signals a continuation of the uptrend, presenting a buying opportunity for traders.
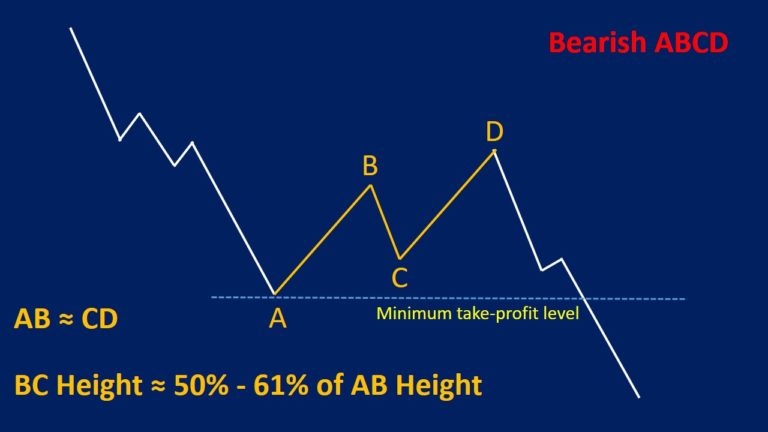
Example 2: Downtrend Reversal
Consider a currency pair that has been trending downward. The pair begins to correct upward, forming Wave A. A subsequent retracement forms Wave B, followed by a downward move that breaks below the low of Wave A, forming Wave C. In this scenario, the ABC pattern indicates a potential downtrend reversal, offering a selling opportunity for traders.
Example 3: Using Fibonacci Levels
Fibonacci retracement levels can be used to identify potential support and resistance levels within an ABC pattern. For example, if Wave B retraces to the 61.8% Fibonacci level of Wave A, it can provide a potential entry point for Wave C. Traders often use these levels in conjunction with other technical indicators to confirm their trading decisions. Understanding Fibonacci in ABC pattern examples enhances the accuracy of predictions.
Trading Strategies Based on ABC Patterns
Once you’ve identified an ABC pattern, the next step is to develop a trading strategy to profit from it. Here are a few common strategies:
Entry Points
The most common entry point is at the completion of Wave C. Traders often wait for a confirmation signal, such as a breakout above the high of Wave A in an uptrend or a breakdown below the low of Wave A in a downtrend. Using stop-loss orders is crucial to manage risk.
Target Levels
Target levels can be determined using Fibonacci extensions. For example, traders might target the 127.2% or 161.8% Fibonacci extension of Wave A from the end of Wave B. These levels provide potential profit targets based on the expected continuation of the trend. Analyzing past ABC pattern examples helps refine target setting.
Stop-Loss Placement
Stop-loss orders should be placed strategically to protect against unexpected price movements. A common placement is below the low of Wave B in an uptrend or above the high of Wave B in a downtrend. This placement helps to limit potential losses if the pattern fails to materialize.
Tools and Indicators to Enhance ABC Pattern Identification
While identifying ABC pattern examples can be done visually, certain tools and indicators can enhance accuracy and efficiency.
Fibonacci Retracement Tool
As mentioned earlier, Fibonacci retracement levels can help identify potential support and resistance within the pattern. This tool is widely available on most trading platforms.
Elliott Wave Theory
The Elliott Wave Theory provides a framework for understanding market cycles and can be used to identify ABC patterns within larger wave structures. While complex, understanding the basics of Elliott Wave Theory can provide valuable context for your trading decisions.
Moving Averages
Moving averages can help identify the underlying trend and confirm the direction of the ABC pattern. For example, if the price is above a 200-day moving average, it suggests an uptrend, and traders might look for bullish ABC pattern examples.
Common Mistakes to Avoid When Trading ABC Patterns
Trading ABC patterns can be profitable, but it’s essential to avoid common mistakes that can lead to losses.
Ignoring Confirmation Signals
Entering a trade without confirmation can be risky. Always wait for a clear signal, such as a breakout or breakdown, before entering a position. Confirming the pattern with volume indicators can also increase the odds of success.
Over-Leveraging
Using excessive leverage can amplify both profits and losses. It’s crucial to manage risk by using appropriate position sizing and stop-loss orders. Understanding the risk involved in ABC pattern examples is essential.
Failing to Adapt to Market Conditions
Market conditions can change rapidly, and it’s essential to adapt your trading strategy accordingly. Be prepared to adjust your target levels and stop-loss orders based on market volatility and other factors.
The Psychology Behind ABC Patterns
Understanding the psychology behind ABC patterns can provide valuable insights into market behavior. Wave A represents the initial reaction to a change in sentiment. Wave B is often driven by profit-taking or a temporary pullback. Wave C represents the resumption of the original trend as traders regain confidence. Recognizing the psychological factors influencing ABC pattern examples can enhance trading decisions.
Advanced Techniques for Trading ABC Patterns
For experienced traders, there are advanced techniques that can further refine their ABC pattern trading strategies.
Combining with Harmonic Patterns
Harmonic patterns, such as the Gartley or Bat pattern, can be combined with ABC patterns to identify high-probability trading opportunities. These patterns often occur at key Fibonacci levels, providing confluence for entry and exit points. Analyzing ABC pattern examples alongside harmonic patterns can increase accuracy.
Using Volume Analysis
Volume analysis can provide valuable insights into the strength of the ABC pattern. High volume during Wave C can confirm the resumption of the original trend, while low volume might suggest a weaker signal. Monitoring volume in ABC pattern examples is crucial for validation.
Time-Based Analysis
Analyzing the time it takes for each wave to form can provide clues about the potential strength and duration of the pattern. For example, if Wave C takes significantly longer to form than Wave A, it might suggest a weaker trend continuation. Time analysis enhances the understanding of ABC pattern examples.
Conclusion
Mastering the ABC pattern requires a combination of theoretical knowledge, practical experience, and disciplined risk management. By understanding the different types of ABC patterns, identifying them in real-world trading scenarios, and applying effective trading strategies, traders can significantly enhance their profitability. Remember to continuously refine your skills, adapt to changing market conditions, and always prioritize risk management. Recognizing and utilizing ABC pattern examples can provide a significant edge in the competitive world of trading. [See also: Fibonacci Trading Strategies] [See also: Understanding Elliott Wave Theory] [See also: Technical Analysis for Beginners]
