
Decoding the Red Hammer Candlestick: A Comprehensive Guide for Traders
In the dynamic world of financial markets, identifying potential trend reversals is crucial for successful trading. The red hammer candlestick pattern is a valuable tool in this endeavor. This article provides a comprehensive understanding of the red hammer candlestick, its formation, interpretation, and practical application in trading strategies. We’ll delve into its characteristics, differentiating it from other candlestick patterns, and explore how to use it effectively in conjunction with other technical indicators.
Understanding Candlestick Patterns
Before diving into the specifics of the red hammer candlestick, it’s essential to understand the basics of candlestick patterns. Candlesticks are graphical representations of price movements for a specific period. Each candlestick displays four key data points: the open price, the close price, the high price, and the low price. The body of the candlestick represents the range between the open and close prices, while the wicks (or shadows) represent the high and low prices for the period.
Different candlestick patterns can signal potential bullish or bearish reversals, continuations of existing trends, or periods of indecision. Recognizing these patterns can provide valuable insights into market sentiment and potential future price movements. The red hammer candlestick is one such pattern that traders often watch for.
What is a Red Hammer Candlestick?
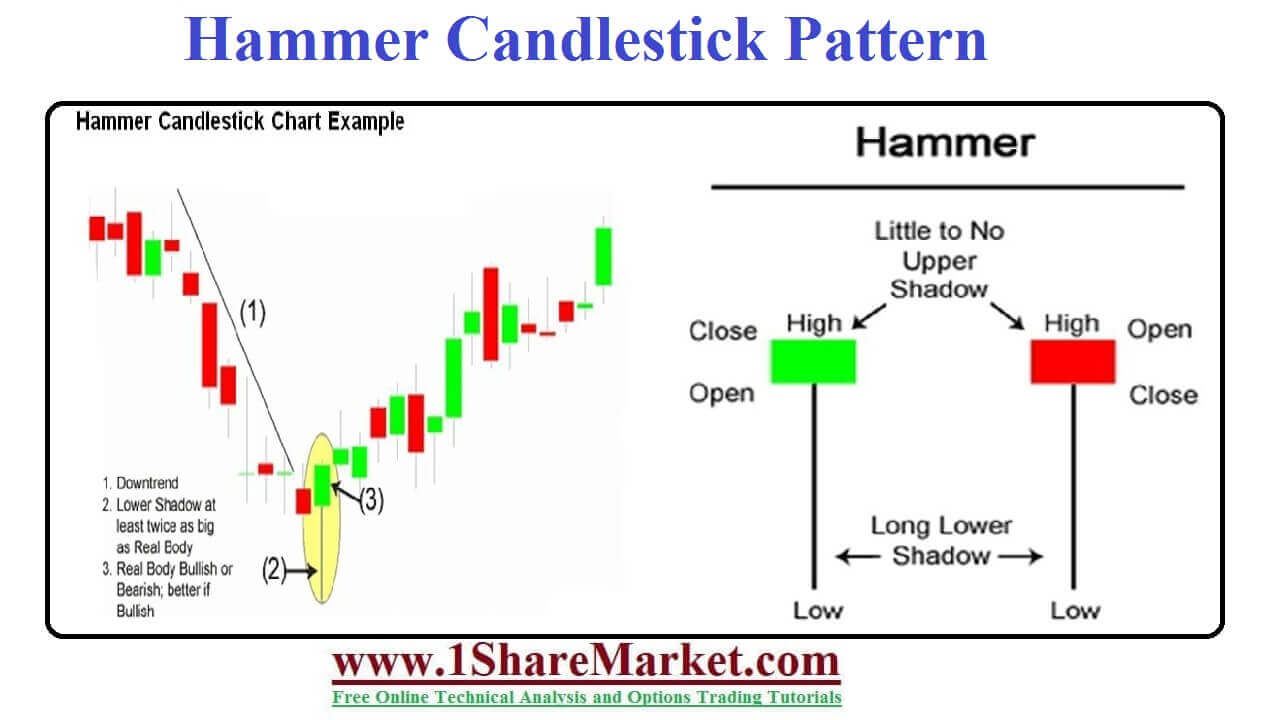
A red hammer candlestick is a bullish reversal pattern that forms after a downtrend. It is characterized by a small body at the upper end of the trading range and a long lower wick, which is at least twice the length of the body. The color of the body (red or green) is not as important as the shape, but a red hammer candlestick indicates that the closing price was below the opening price. The absence of a significant upper wick is also a defining characteristic.
The formation of a red hammer candlestick suggests that during the period, sellers initially drove the price down significantly. However, buyers stepped in and pushed the price back up towards the opening price, indicating a potential shift in momentum from bearish to bullish. The long lower wick represents the extent of the selling pressure that was ultimately overcome by buying pressure.
Key Characteristics of the Red Hammer Candlestick
- Small Body: The body of the candlestick is small, indicating that the opening and closing prices were relatively close to each other.
- Long Lower Wick: The lower wick is at least twice the length of the body, signifying a significant rejection of lower prices.
- Little or No Upper Wick: The absence of a substantial upper wick suggests that the price did not rise much above the opening price.
- Appears After a Downtrend: The red hammer candlestick is a reversal pattern, so it must form after a period of declining prices to be considered valid.
How to Identify a Red Hammer Candlestick
Identifying a red hammer candlestick involves carefully examining the candlestick’s shape and its context within the price chart. Here’s a step-by-step guide:
- Look for a Downtrend: Ensure that the candlestick pattern is forming after a period of declining prices. The longer and more established the downtrend, the more significant the potential reversal signal.
- Identify the Candlestick Shape: Look for a candlestick with a small body, a long lower wick (at least twice the length of the body), and little or no upper wick.
- Consider the Color: While the color is not as critical as the shape, a red hammer candlestick indicates the closing price was lower than the opening price.
- Confirm with Other Indicators: Use other technical indicators, such as volume or oscillators, to confirm the potential reversal signal.
Interpreting the Red Hammer Candlestick
The red hammer candlestick indicates that buyers have started to exert their influence and potentially reverse the downtrend. The long lower wick shows that sellers initially pushed the price down, but buyers stepped in and drove the price back up. This suggests that the selling pressure is weakening, and the buying pressure is increasing.
However, it’s important to note that a red hammer candlestick is not a guaranteed signal of a reversal. It’s crucial to confirm the signal with other technical indicators and price action before making any trading decisions. A strong confirmation might be a gap up or a bullish candlestick forming in the subsequent period after the red hammer candlestick.
Red Hammer Candlestick vs. Other Candlestick Patterns
It’s important to differentiate the red hammer candlestick from other similar candlestick patterns to avoid confusion and ensure accurate interpretation. Here are some key differences:
Hammer vs. Hanging Man
Both the Hammer and Hanging Man patterns have the same shape: a small body and a long lower wick. However, the Hammer appears after a downtrend (signaling a potential bullish reversal), while the Hanging Man appears after an uptrend (signaling a potential bearish reversal). The context in which these patterns appear is crucial for their interpretation.
Hammer vs. Inverted Hammer
The Inverted Hammer has a small body and a long upper wick, unlike the Hammer, which has a long lower wick. The Inverted Hammer also appears after a downtrend and signals a potential bullish reversal, but the psychology behind it is different. The Inverted Hammer suggests that buyers tried to push the price higher, but sellers pushed it back down, indicating potential buying pressure. The red hammer candlestick, on the other hand, indicates that sellers initially drove the price down, but buyers pushed it back up.
Hammer vs. Spinning Top
A Spinning Top has a small body and both upper and lower wicks. It represents indecision in the market, with neither buyers nor sellers in control. The red hammer candlestick, however, suggests a potential shift from bearish to bullish momentum.
Trading Strategies Using the Red Hammer Candlestick
The red hammer candlestick can be incorporated into various trading strategies. Here are a few examples:
Confirmation Entry
Wait for confirmation before entering a trade based on the red hammer candlestick. This could involve waiting for a bullish candlestick to form in the subsequent period, a gap up, or a break above a key resistance level. This approach reduces the risk of false signals.
Stop-Loss Placement
Place a stop-loss order below the low of the red hammer candlestick. This limits potential losses if the reversal does not materialize and the price continues to decline.
Target Price
Set a target price based on technical analysis principles, such as Fibonacci retracement levels or previous resistance levels. Alternatively, use a trailing stop-loss to capture as much profit as possible if the price continues to rise.
Combining with Other Indicators
Use other technical indicators, such as the Relative Strength Index (RSI) or Moving Average Convergence Divergence (MACD), to confirm the red hammer candlestick signal. For example, if the RSI is oversold when the red hammer candlestick forms, it increases the likelihood of a bullish reversal.
Examples of Red Hammer Candlestick in Real-World Scenarios
Let’s consider a hypothetical scenario where a stock has been in a downtrend for several weeks. The price has been consistently declining, and investor sentiment is bearish. Suddenly, a red hammer candlestick forms on the daily chart. This suggests that buyers are starting to step in and reject the lower prices. If the subsequent candlestick is bullish and breaks above the high of the red hammer candlestick, it could be a strong signal to enter a long position. [See also: Identifying Reversal Patterns]
Another example could be in the forex market. Suppose the EUR/USD pair has been declining, and a red hammer candlestick forms near a key support level. This could indicate that the downtrend is losing momentum and a potential reversal is imminent. Traders might look for confirmation signals, such as a break above a short-term moving average, before entering a long position.
Limitations of the Red Hammer Candlestick
While the red hammer candlestick can be a valuable tool, it’s essential to be aware of its limitations:
- False Signals: Like all technical indicators, the red hammer candlestick can generate false signals. It’s crucial to confirm the signal with other indicators and price action.
- Subjectivity: Identifying candlestick patterns can be subjective, and different traders may interpret them differently.
- Market Context: The effectiveness of the red hammer candlestick depends on the overall market context. It may be less reliable in highly volatile or choppy markets.
Conclusion
The red hammer candlestick is a powerful bullish reversal pattern that can provide valuable insights into potential trend changes. By understanding its formation, characteristics, and limitations, traders can effectively incorporate it into their trading strategies. Remember to always confirm the signal with other technical indicators and price action before making any trading decisions. With practice and experience, the red hammer candlestick can become a valuable tool in your trading arsenal. The key is to use this pattern judiciously and in conjunction with other forms of technical and fundamental analysis. A red hammer candlestick alone doesn’t guarantee profit, but it certainly can increase the probability of a winning trade when used correctly. [See also: Mastering Candlestick Analysis]
