Unlocking Market Secrets: A Comprehensive Guide to the Hammer Pattern
In the dynamic world of financial markets, identifying potential trend reversals is crucial for successful trading. One such indicator, highly regarded by technical analysts, is the hammer pattern. This candlestick pattern, characterized by its distinctive shape, can signal a potential bullish reversal after a downtrend. Understanding the nuances of the hammer pattern, its formation, and its implications can significantly enhance a trader’s ability to make informed decisions. This comprehensive guide delves into the intricacies of the hammer pattern, providing insights into its identification, validation, and application in real-world trading scenarios.
What is the Hammer Pattern?
The hammer pattern is a single-candlestick bullish reversal pattern that forms during a downtrend. It gets its name from its shape, which resembles a hammer. The candlestick has a small body, a long lower shadow (or wick), and a little or no upper shadow. The length of the lower shadow should be at least twice the length of the body. This long lower shadow indicates that sellers initially pushed the price lower, but buyers then stepped in and drove the price back up towards the opening price.
Essentially, the hammer pattern signifies a potential shift in market sentiment from bearish to bullish. It suggests that the selling pressure is waning and that buyers are starting to gain control. The longer the lower shadow, the stronger the potential reversal signal.
Identifying the Hammer Pattern
Properly identifying the hammer pattern is essential for accurate analysis. Here’s a breakdown of the key characteristics:
- Prior Trend: The pattern must appear after a defined downtrend. This downtrend doesn’t need to be long, but it should be clearly identifiable.
- Small Body: The real body (the difference between the open and close price) should be small. The color of the body is not as important, but a bullish (white or green) body is generally considered more significant.
- Long Lower Shadow: The lower shadow should be at least twice the length of the body. This represents the rejection of lower prices.
- Little or No Upper Shadow: Ideally, there should be no upper shadow, or a very small one. A significant upper shadow weakens the bullish signal.
It’s important to note that not every candlestick resembling a hammer is necessarily a valid hammer pattern. The context in which it appears is crucial. The preceding trend, the length of the shadows, and the size of the body all contribute to the pattern’s significance.
The Psychology Behind the Hammer Pattern
The hammer pattern reflects a battle between buyers and sellers. During the downtrend, sellers are in control, driving the price lower. The long lower shadow indicates that sellers initially continued to push the price down during the period represented by the candlestick. However, buyers then entered the market, aggressively buying up the dip and pushing the price back up towards the opening price. This buying pressure suggests that the downtrend may be losing momentum and that buyers are gaining strength. This shift in sentiment is what makes the hammer pattern a potential bullish reversal signal.
Confirmation of the Hammer Pattern
While the hammer pattern is a valuable indicator, it should not be used in isolation. Confirmation from other technical indicators is crucial to increase the probability of a successful trade. Here are some common methods of confirming the hammer pattern:
- Bullish Confirmation Candle: The most common form of confirmation is a bullish candlestick (white or green) that closes above the high of the hammer pattern on the following day. This indicates that buyers have followed through on the potential reversal signal.
- Volume: Increased volume on the hammer pattern day and the confirmation day strengthens the signal. Higher volume suggests greater conviction among buyers.
- Moving Averages: Look for the hammer pattern to form near a key moving average support level. This can provide additional confirmation of the potential reversal.
- Other Indicators: Indicators like the Relative Strength Index (RSI) or Moving Average Convergence Divergence (MACD) can be used to confirm the hammer pattern. For example, if the RSI is oversold and the hammer pattern forms, it can be a stronger signal.
Without confirmation, the hammer pattern is simply a potential signal, not a guaranteed reversal. Always wait for confirmation before entering a trade based on this pattern. [See also: Understanding Candlestick Patterns for Profitable Trading]
Examples of the Hammer Pattern in Trading
Let’s consider a few hypothetical examples of how the hammer pattern might be used in trading:
Example 1: A stock has been in a downtrend for several weeks. A hammer pattern forms near a key support level, with a long lower shadow and a small body. The next day, a bullish candlestick closes above the high of the hammer pattern, with above-average volume. This confirms the hammer pattern, suggesting a potential bullish reversal. A trader might enter a long position, placing a stop-loss order below the low of the hammer pattern.
Example 2: A currency pair has been declining steadily. A hammer pattern forms on the daily chart. The RSI is also showing oversold conditions. The following day, a bullish candlestick confirms the hammer pattern. A trader might consider entering a long position, targeting a previous resistance level as a potential profit target.
Example 3: A commodity has been experiencing a pullback. A hammer pattern appears, but the following day’s candlestick is bearish, failing to close above the high of the hammer pattern. This lack of confirmation suggests that the potential reversal is not yet valid. The trader would wait for further confirmation before considering a long position.
Distinguishing the Hammer Pattern from Other Candlestick Patterns
It’s crucial to differentiate the hammer pattern from other similar candlestick patterns, such as the Hanging Man and the Inverted Hammer. While they may look similar, their implications are quite different.
- Hanging Man: The Hanging Man pattern looks identical to the hammer pattern but appears at the end of an uptrend, signaling a potential bearish reversal.
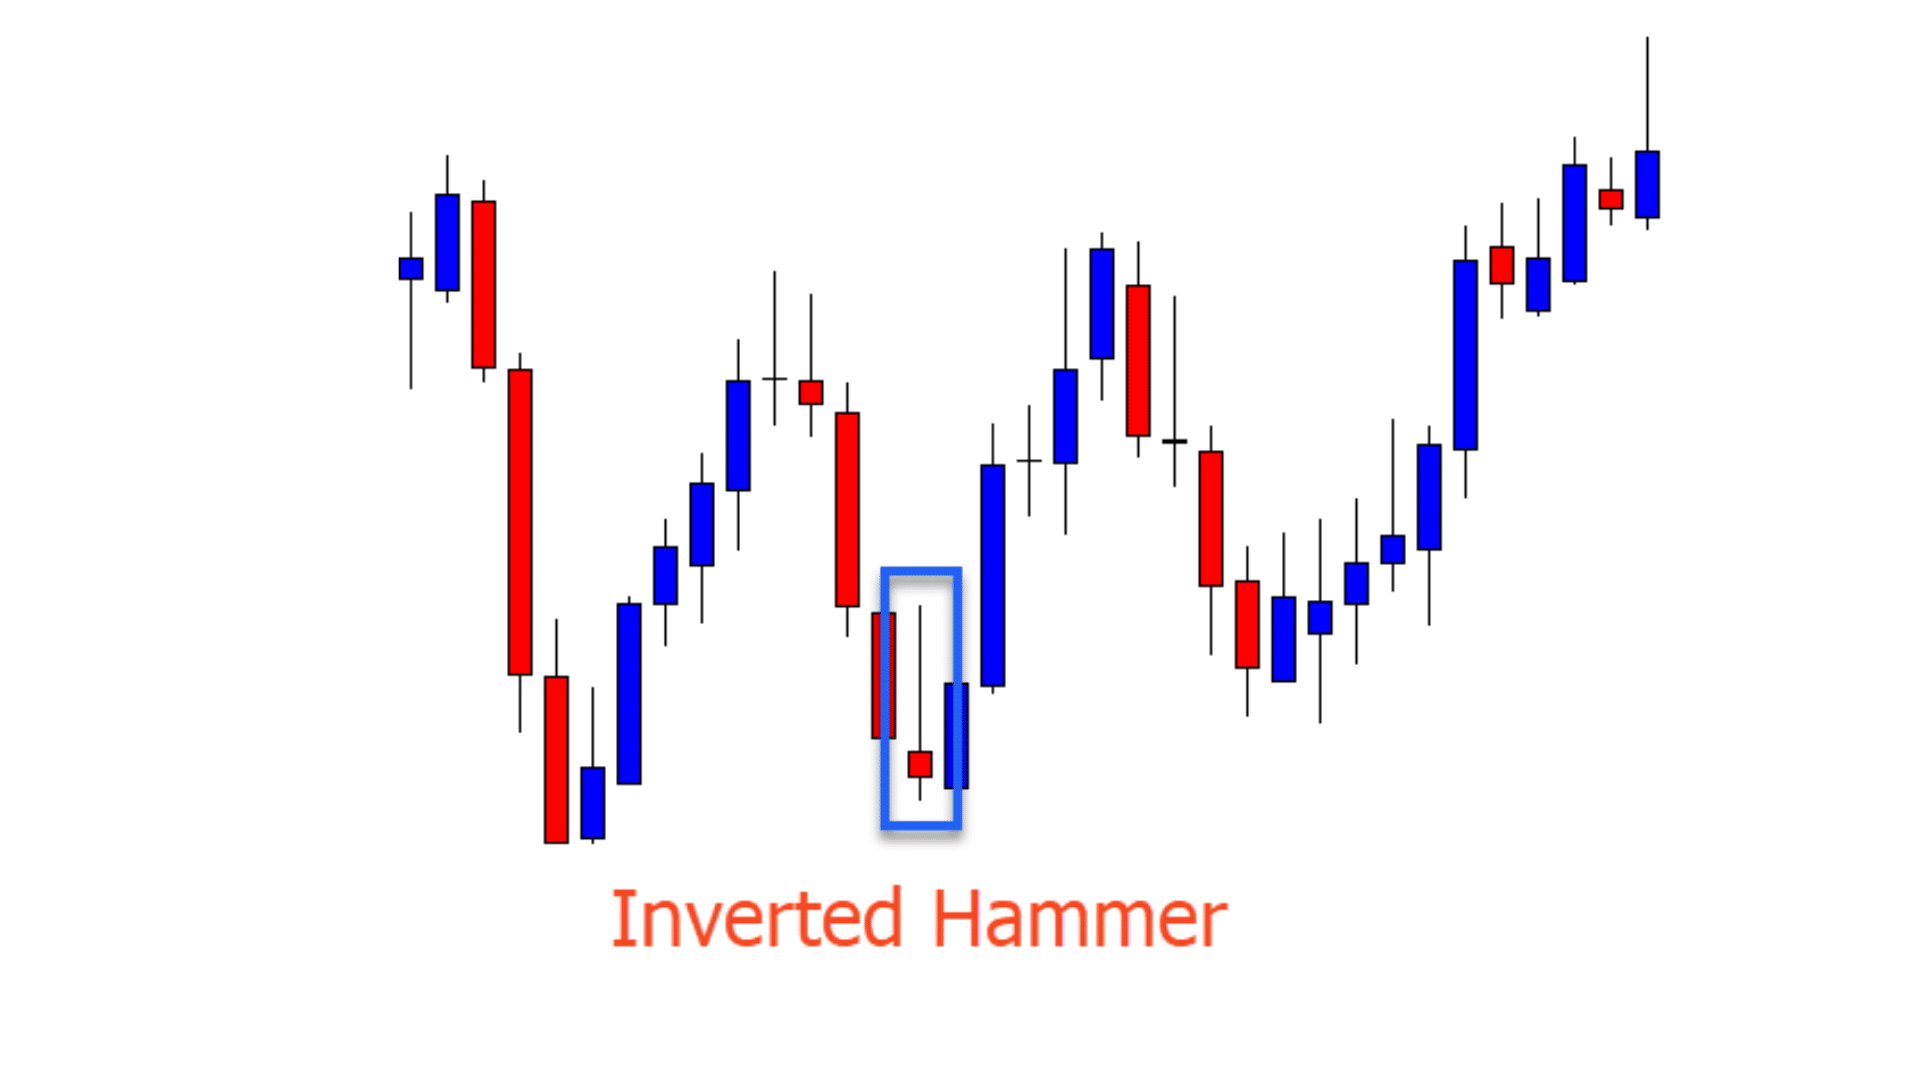
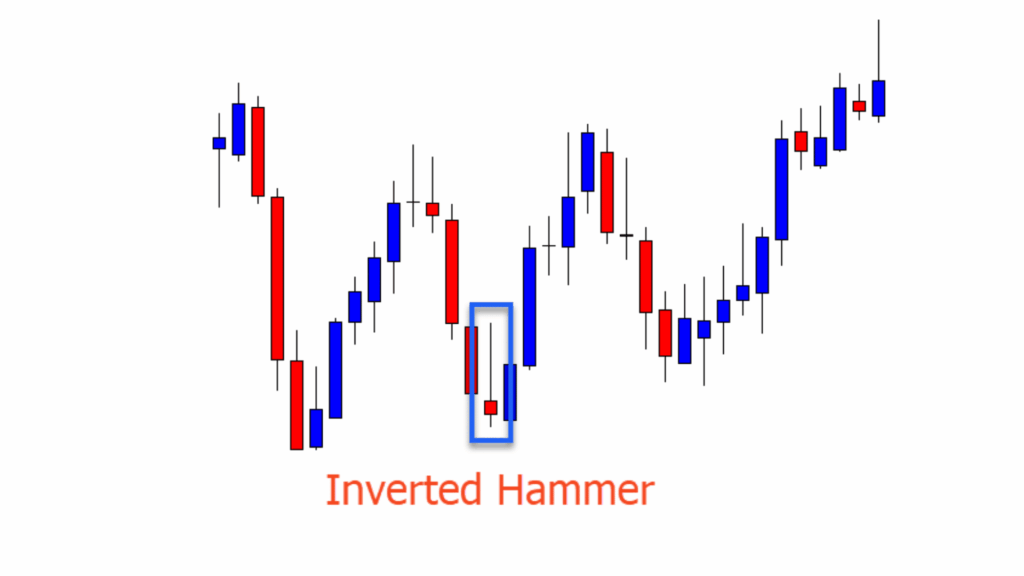
- Inverted Hammer: The Inverted Hammer has a small body and a long upper shadow, with little or no lower shadow. It appears after a downtrend and suggests a potential bullish reversal, but the upper shadow indicates that buyers were able to push the price up, but sellers then pushed it back down.
Careful observation and understanding of the preceding trend are essential for correctly identifying these patterns. Mistaking one for another can lead to incorrect trading decisions.
Advantages and Limitations of Using the Hammer Pattern
Like any technical analysis tool, the hammer pattern has its advantages and limitations. Understanding these can help traders use it more effectively.
Advantages:
- Early Reversal Signal: The hammer pattern can provide an early indication of a potential trend reversal.
- Clear Entry and Stop-Loss Levels: The pattern provides clear levels for entry and stop-loss orders. Traders can enter long positions after confirmation and place stop-loss orders below the low of the hammer pattern.
- Easy to Identify: The pattern is relatively easy to identify on a candlestick chart.
Limitations:
- Requires Confirmation: The hammer pattern is not reliable on its own and requires confirmation from other indicators.
- Can Produce False Signals: Like all technical indicators, the hammer pattern can produce false signals.
- Subjectivity: The interpretation of the hammer pattern can be subjective. Different traders may interpret the same pattern differently.
Tips for Trading with the Hammer Pattern
Here are some tips to help you trade more effectively with the hammer pattern:
- Always Look for Confirmation: Never trade the hammer pattern in isolation. Always wait for confirmation from other indicators or price action.
- Consider the Context: Pay attention to the overall market context. Is the market trending or ranging? Are there any major news events that could affect the price?
- Use Stop-Loss Orders: Always use stop-loss orders to limit your potential losses. Place your stop-loss order below the low of the hammer pattern.
- Practice Proper Risk Management: Never risk more than you can afford to lose on a single trade.
- Backtest Your Strategies: Before trading the hammer pattern with real money, backtest your strategies on historical data to see how they would have performed in the past.
Hammer Pattern Variations
While the classic hammer pattern has a small body and a long lower shadow, slight variations exist. These variations still indicate potential bullish reversals but might require careful consideration.
- Doji Hammer: This variation features a Doji candlestick (where the open and close prices are virtually the same) instead of a small body. The long lower shadow remains a key characteristic.
- Long-Legged Doji Hammer: This variation has a Doji body and very long upper and lower shadows, suggesting significant price volatility during the trading period.
The Hammer Pattern in Different Timeframes
The hammer pattern can be observed across various timeframes, from intraday charts to weekly charts. The significance of the pattern can vary depending on the timeframe. Generally, hammer patterns on longer timeframes (e.g., daily or weekly) tend to be more reliable than those on shorter timeframes (e.g., hourly or 15-minute). This is because longer timeframes filter out more of the short-term noise and provide a clearer picture of the underlying trend.
Conclusion
The hammer pattern is a valuable tool for technical analysts seeking to identify potential bullish reversals in the market. By understanding its characteristics, psychology, and limitations, traders can use it effectively in conjunction with other technical indicators to make informed trading decisions. Remember to always wait for confirmation, practice proper risk management, and backtest your strategies before trading with real money. The hammer pattern is a powerful indicator when used correctly, offering insights into potential market shifts and profitable trading opportunities. Incorporating the hammer pattern into your trading strategy can provide a significant edge in navigating the complexities of the financial markets. [See also: Mastering Technical Analysis for Consistent Profits]
