
Decoding Market Movements: Mastering the MACD RSI Indicator for Strategic Trading
In the dynamic world of financial markets, traders and investors constantly seek reliable tools to analyze price movements and make informed decisions. Among the plethora of technical indicators available, the MACD RSI indicator stands out as a powerful combination, offering a comprehensive view of market momentum and potential trend reversals. This article delves into the intricacies of the MACD RSI indicator, exploring its components, interpretation, and practical applications in crafting effective trading strategies.
Understanding the Core Components
Moving Average Convergence Divergence (MACD)
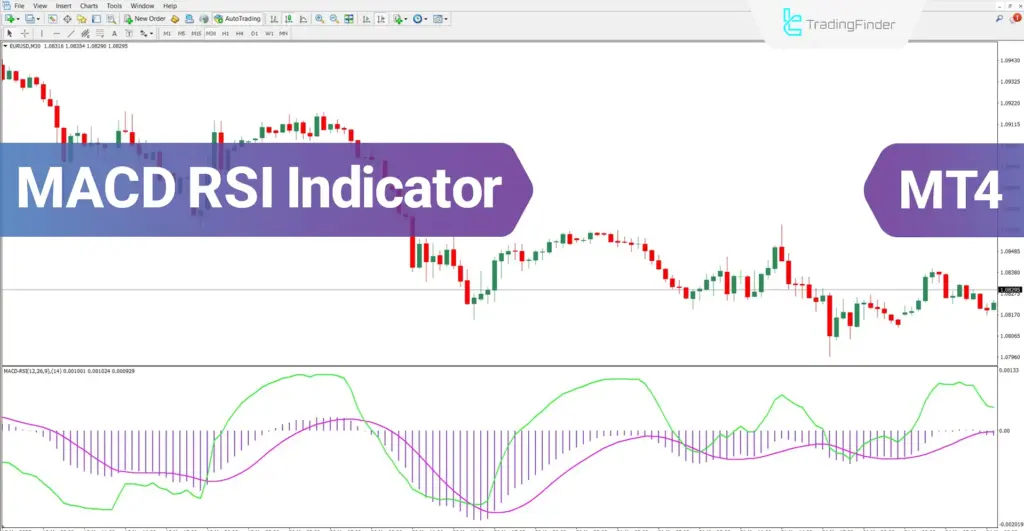
The Moving Average Convergence Divergence (MACD) is a momentum indicator that illustrates the relationship between two moving averages of a security’s price. It consists of the MACD line, the signal line, and the histogram. The MACD line is calculated by subtracting the 26-period Exponential Moving Average (EMA) from the 12-period EMA. The signal line is a 9-period EMA of the MACD line. The histogram represents the difference between the MACD line and the signal line, visually depicting the momentum of the trend.
A bullish signal is generated when the MACD line crosses above the signal line, suggesting upward momentum. Conversely, a bearish signal occurs when the MACD line crosses below the signal line, indicating downward momentum. The histogram provides additional confirmation, with increasing values above zero reinforcing bullish sentiment and decreasing values below zero confirming bearish sentiment. Traders often use the MACD to identify potential entry and exit points in the market.
Relative Strength Index (RSI)
The Relative Strength Index (RSI) is a momentum oscillator that measures the speed and change of price movements. It oscillates between 0 and 100, with readings above 70 typically indicating overbought conditions and readings below 30 suggesting oversold conditions. The RSI helps traders identify potential trend reversals and assess the strength of a current trend.
When the RSI reaches overbought levels, it signals that the asset may be overvalued and prone to a price correction. Conversely, when the RSI reaches oversold levels, it suggests that the asset may be undervalued and poised for a potential rebound. Traders often look for divergences between the RSI and price action to identify potential trend reversals. For example, if the price is making higher highs but the RSI is making lower highs, it could indicate weakening momentum and a potential bearish reversal.
Combining MACD and RSI: A Synergistic Approach
While both the MACD and RSI are valuable indicators on their own, combining them can provide a more comprehensive and reliable view of market dynamics. The MACD RSI indicator allows traders to filter out false signals and identify high-probability trading opportunities. By analyzing both momentum and overbought/oversold conditions, traders can gain a deeper understanding of the underlying market forces driving price movements.
One common strategy is to use the MACD to identify the direction of the trend and the RSI to confirm the strength of the trend. For example, if the MACD generates a bullish signal and the RSI is above 50, it suggests a strong upward trend. Conversely, if the MACD generates a bearish signal and the RSI is below 50, it indicates a strong downward trend. This combination helps traders avoid entering trades against the prevailing trend.
Another approach is to look for divergences between the MACD and RSI to identify potential trend reversals. For example, if the price is making higher highs but the MACD is making lower highs and the RSI is in overbought territory, it could signal a potential bearish reversal. Similarly, if the price is making lower lows but the MACD is making higher lows and the RSI is in oversold territory, it could indicate a potential bullish reversal.
Practical Applications and Trading Strategies
Identifying Trend Reversals
The MACD RSI indicator is particularly useful for identifying potential trend reversals. By looking for divergences between price action and the indicators, traders can anticipate changes in market direction and position themselves accordingly. For example, a bearish divergence occurs when the price makes a higher high, but the MACD and RSI fail to confirm this high, indicating weakening momentum and a potential downward reversal. [See also: Understanding Divergence in Trading]
Confirming Trend Strength
In addition to identifying reversals, the MACD RSI indicator can also be used to confirm the strength of an existing trend. When both the MACD and RSI are aligned in the same direction, it reinforces the validity of the trend. For example, if the MACD is trending upward and the RSI is above 50, it confirms the strength of the uptrend, providing traders with confidence to enter long positions.
Generating Buy and Sell Signals
The MACD RSI indicator can generate buy and sell signals based on specific criteria. A common strategy is to buy when the MACD line crosses above the signal line and the RSI is above 30, indicating increasing momentum and oversold conditions. Conversely, a sell signal is generated when the MACD line crosses below the signal line and the RSI is below 70, indicating decreasing momentum and overbought conditions. These signals provide traders with clear entry and exit points.
Advanced Techniques and Considerations
Using Multiple Timeframes
To enhance the accuracy of the MACD RSI indicator, traders often use multiple timeframes. By analyzing the indicators on different timeframes, such as daily, weekly, and monthly charts, traders can gain a more comprehensive view of the market and identify potential trading opportunities that may not be apparent on a single timeframe. For example, a bullish signal on a weekly chart can provide a higher degree of confidence than a bullish signal on a daily chart.
Combining with Other Indicators
The MACD RSI indicator can be combined with other technical indicators to further refine trading strategies. For example, traders may use moving averages to identify the overall trend and then use the MACD RSI indicator to identify potential entry and exit points within that trend. [See also: Integrating Moving Averages with Other Indicators] Combining indicators can provide a more robust and reliable trading system.
Risk Management
As with any trading strategy, risk management is crucial when using the MACD RSI indicator. Traders should always use stop-loss orders to limit potential losses and manage their position size to avoid overexposure to the market. It is also important to consider the overall market conditions and economic factors that may impact price movements. The MACD RSI indicator is a valuable tool, but it should not be used in isolation.
Real-World Examples and Case Studies
To illustrate the practical application of the MACD RSI indicator, let’s examine a few real-world examples. Consider a hypothetical scenario where a stock’s price has been trending upward for several weeks. The MACD line is above the signal line, indicating bullish momentum, and the RSI is hovering around 65, suggesting that the stock is approaching overbought territory. In this case, a trader might wait for the RSI to reach 70 or higher before considering a short position, anticipating a potential pullback. The MACD RSI indicator would help confirm the timing of this trade.
In another scenario, a stock’s price has been declining steadily. The MACD line is below the signal line, indicating bearish momentum, and the RSI is around 35, suggesting that the stock is approaching oversold territory. A trader might look for a bullish divergence between the price and the RSI, where the price makes a lower low but the RSI makes a higher low. This divergence could signal a potential bullish reversal, providing an opportunity to enter a long position. Again, the MACD RSI indicator provides a clear signal for action.
Common Pitfalls and How to Avoid Them
While the MACD RSI indicator is a powerful tool, it is not without its limitations. One common pitfall is relying solely on the indicators without considering other factors, such as fundamental analysis and market sentiment. Traders should always conduct thorough research and analysis before making any trading decisions.
Another pitfall is ignoring the overall trend. The MACD RSI indicator is most effective when used in conjunction with the prevailing trend. Trading against the trend can be risky and lead to significant losses. Traders should always identify the overall trend before using the MACD RSI indicator to generate buy and sell signals.
Finally, it is important to avoid overtrading. The MACD RSI indicator can generate numerous signals, but not all of them are reliable. Traders should be selective and only act on signals that are supported by other indicators and analysis. Overtrading can lead to increased transaction costs and emotional decision-making.
Conclusion: Harnessing the Power of MACD RSI
The MACD RSI indicator is a valuable tool for traders and investors seeking to analyze market momentum and identify potential trend reversals. By understanding the components of the MACD RSI indicator, its interpretation, and its practical applications, traders can craft effective trading strategies and improve their overall performance. While the MACD RSI indicator is not a foolproof system, it can provide valuable insights into market dynamics and help traders make more informed decisions. The effective use of the MACD RSI indicator requires a thorough understanding of its components and how they interact. The MACD RSI indicator is a powerful tool when used correctly. The MACD RSI indicator combines momentum and relative strength. Understanding the MACD RSI indicator can significantly improve trading strategies. Many traders rely on the MACD RSI indicator for entry and exit signals. The MACD RSI indicator helps in identifying potential trend reversals. Mastering the MACD RSI indicator is key to successful trading. Using the MACD RSI indicator effectively requires practice and patience. The MACD RSI indicator should be used in conjunction with other analysis methods. The MACD RSI indicator can provide valuable insights into market dynamics. The MACD RSI indicator is a versatile tool for traders of all levels.
Remember to always practice proper risk management and continue learning to refine your trading skills. The journey to mastering the markets is a continuous one, and tools like the MACD RSI indicator can be invaluable companions along the way. The MACD RSI indicator offers a unique perspective on market movements. The MACD RSI indicator is widely used in technical analysis. The combined power of the MACD RSI indicator can lead to better trading outcomes. The MACD RSI indicator helps traders make more informed decisions. The MACD RSI indicator is a staple in many trading strategies. The MACD RSI indicator provides both momentum and overbought/oversold signals. The MACD RSI indicator is a must-know for serious traders.
