
Decoding the Red Hammer Candlestick: A Comprehensive Guide for Traders
In the dynamic world of financial markets, traders are constantly seeking reliable tools to predict future price movements. Among the most popular and visually intuitive of these tools are candlestick patterns. One such pattern, the red hammer candlestick, is a crucial indicator that can signal potential bullish reversals. Understanding the nuances of the red hammer candlestick can significantly enhance a trader’s ability to make informed decisions. This comprehensive guide delves into the intricacies of the red hammer candlestick, exploring its formation, interpretation, and application in real-world trading scenarios. We will also discuss its limitations and how to combine it with other technical indicators for greater accuracy.
What is a Red Hammer Candlestick?
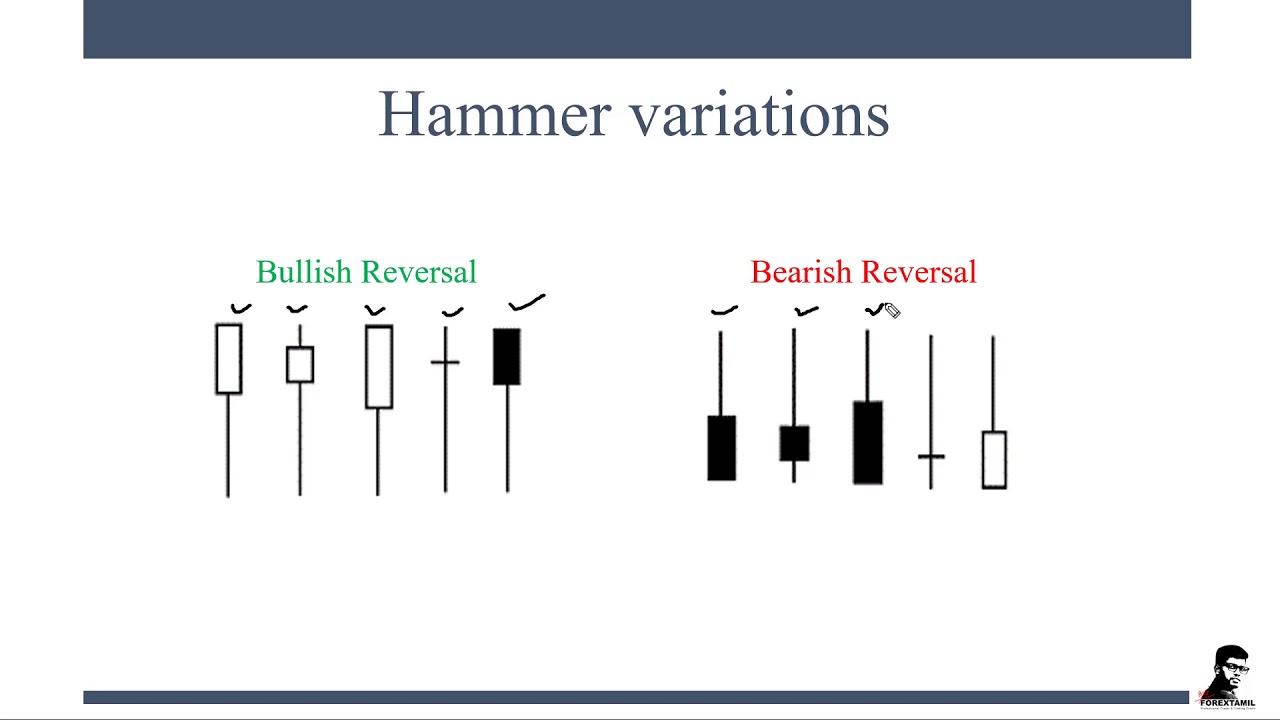
The red hammer candlestick is a single candlestick pattern that appears on a price chart and suggests a potential bullish reversal in a downtrend. It gets its name from its resemblance to a hammer, with a small body located at the upper end of the trading range and a long lower shadow (or wick) that is at least twice the length of the body. Crucially, the red hammer candlestick is red (or bearish), meaning that the closing price is lower than the opening price for that period. This adds a layer of complexity to its interpretation, as a bullish reversal signal originating from a bearish candle might seem counterintuitive.
Formation of the Red Hammer
To fully grasp the significance of the red hammer candlestick, it’s essential to understand how it forms. The creation of this candlestick pattern involves a specific sequence of price action during a trading period:
- Downtrend: The market must be in a downtrend before the pattern can be considered a red hammer candlestick. This means that prices have been generally declining.
- Opening Price: The candlestick opens at a certain price level.
- Significant Selling Pressure: Early in the trading period, there is significant selling pressure, causing the price to decline sharply. This creates the long lower shadow.
- Buying Pressure Emerges: As the period progresses, buyers step in and begin to push the price back up. This indicates a shift in sentiment.
- Closing Price: The price closes near the opening price, but lower than the opening price, forming a small red body at the top of the candlestick’s range.
Interpreting the Red Hammer Candlestick
The red hammer candlestick is a visual representation of a battle between sellers and buyers. The long lower shadow indicates that sellers were initially in control, driving the price down. However, the subsequent buying pressure, which pushed the price back up towards the opening level (or slightly below), signals that buyers are gaining strength. This suggests that the downtrend may be losing momentum and that a bullish reversal could be imminent. The fact that it’s a red hammer candlestick, not a green (or bullish) one, suggests that the buying pressure wasn’t strong enough to completely overcome the selling pressure for that period, but it was significant enough to warrant attention.
Key Considerations
- Confirmation: The red hammer candlestick is most reliable when confirmed by subsequent price action. A confirmation typically comes in the form of a bullish candlestick (a green candle) in the following period, indicating that the buying pressure is continuing. Without confirmation, the red hammer candlestick can be a false signal.
- Volume: Higher trading volume during the formation of the red hammer candlestick adds credibility to the pattern. Increased volume suggests stronger conviction among buyers.
- Location: The red hammer candlestick is most effective when it appears at the end of a well-defined downtrend or near a support level. This increases the likelihood of a reversal.
Trading Strategies Using the Red Hammer Candlestick
Now that we understand the formation and interpretation of the red hammer candlestick, let’s explore some practical trading strategies:
Entry Point
A common entry point for traders using the red hammer candlestick is after the confirmation candle. Once a bullish candlestick forms in the period following the red hammer candlestick, traders may consider entering a long position. Some traders might enter at the open of the confirming candle, while others may wait for a pullback to a support level before entering.
Stop-Loss Order
Managing risk is crucial in trading. A typical stop-loss order placement is just below the low of the red hammer candlestick’s lower shadow. This limits potential losses if the price continues to decline despite the bullish signal.
Profit Target
Determining a profit target depends on the trader’s risk tolerance and the overall market conditions. Some traders may use a fixed risk-reward ratio, such as 1:2 or 1:3, while others may identify potential resistance levels as profit targets. [See also: Identifying Resistance Levels in Trading]
Limitations of the Red Hammer Candlestick
While the red hammer candlestick can be a valuable tool, it’s essential to be aware of its limitations:
- False Signals: Like all technical indicators, the red hammer candlestick can produce false signals. The price may continue to decline despite the appearance of the pattern.
- Subjectivity: The interpretation of candlestick patterns can be subjective. Different traders may interpret the same pattern differently.
- Market Context: The effectiveness of the red hammer candlestick depends on the overall market context. It’s essential to consider other factors, such as economic news and geopolitical events.
Combining the Red Hammer with Other Indicators
To increase the reliability of the red hammer candlestick, traders often combine it with other technical indicators:
Moving Averages
Using moving averages can help confirm the trend reversal suggested by the red hammer candlestick. For example, if the price crosses above a key moving average after the formation of the pattern, it can provide additional confirmation of a bullish reversal. [See also: Using Moving Averages in Technical Analysis]
Relative Strength Index (RSI)
The RSI is a momentum oscillator that measures the speed and change of price movements. If the RSI is oversold (below 30) when the red hammer candlestick appears, it can further strengthen the bullish signal.
Fibonacci Retracement Levels
Fibonacci retracement levels can help identify potential support and resistance levels. If the red hammer candlestick forms near a Fibonacci retracement level, it can increase the likelihood of a successful trade.
Real-World Examples
Let’s look at a couple of real-world examples to illustrate how the red hammer candlestick can be used in trading:
Example 1: Stock XYZ
Stock XYZ has been in a downtrend for several weeks. The price reaches a support level, and a red hammer candlestick forms. The following day, a bullish candlestick confirms the pattern. A trader could enter a long position at the open of the confirming candle, with a stop-loss order placed below the low of the red hammer candlestick’s lower shadow. The profit target could be set at the next resistance level.
Example 2: Currency Pair EUR/USD
The EUR/USD currency pair has been declining. A red hammer candlestick appears near a Fibonacci retracement level. The RSI is also oversold. A trader could interpret this as a strong bullish signal and enter a long position, with a stop-loss order placed below the low of the red hammer candlestick’s lower shadow. The profit target could be set at the next Fibonacci retracement level.
Psychology Behind the Red Hammer Candlestick
Understanding the psychology behind the red hammer candlestick is crucial for making informed trading decisions. The pattern reflects a shift in market sentiment from bearish to potentially bullish. The long lower shadow indicates that sellers initially dominated the trading session, driving the price down to new lows. However, the subsequent rally and close near the opening price suggest that buyers stepped in and aggressively pushed the price back up. This shift in momentum can be a powerful signal that the downtrend is losing steam and a reversal may be on the horizon. The red hammer candlestick highlights the importance of observing market sentiment and understanding the interplay between buyers and sellers.
Conclusion
The red hammer candlestick is a valuable tool for traders seeking to identify potential bullish reversals in a downtrend. By understanding its formation, interpretation, and limitations, traders can enhance their ability to make informed trading decisions. Remember to confirm the pattern with subsequent price action and consider using other technical indicators to increase the reliability of the signal. While the red hammer candlestick is not foolproof, it can be a powerful addition to a trader’s toolkit when used effectively. Always manage risk appropriately and adapt your strategies to the evolving market conditions. The red hammer candlestick can be a great indicator when used alongside other technical analysis tools. Mastering the art of candlestick pattern recognition, including the red hammer candlestick, is a continuous learning process that requires dedication and practice.
