Decoding the ABC Trading Pattern: A Comprehensive Guide
The ABC trading pattern is a popular and relatively simple chart pattern used by traders to identify potential buying or selling opportunities in the financial markets. It’s based on the idea that price movements often occur in predictable waves or swings. Understanding and utilizing the ABC trading pattern can be a valuable tool for both novice and experienced traders looking to improve their market timing and profitability.
This article provides a comprehensive overview of the ABC trading pattern, including its components, how to identify it, trading strategies, and potential limitations. We will delve into the intricacies of this pattern, offering practical insights and examples to help you effectively incorporate it into your trading strategy.
Understanding the Basics of the ABC Pattern
The ABC trading pattern is a three-point price movement pattern that helps traders identify potential continuation or reversal trends. It consists of three distinct legs: A, B, and C. Each leg represents a significant price swing, and the relationship between these legs provides clues about the future direction of the market.
The Components of the ABC Pattern
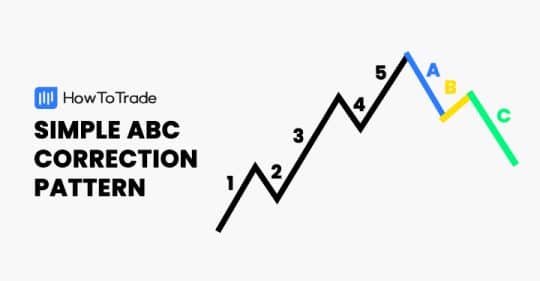
- Point A: The starting point of the pattern. It represents a significant high or low on the price chart.
- Point B: A retracement from Point A. This point marks the end of the first leg and the beginning of a counter-trend movement. The retracement level is crucial for determining the validity of the pattern. Ideally, the retracement should be between 38.2% and 61.8% of the distance from Point A.
- Point C: A continuation of the original trend after the retracement at Point B. This point is where traders look to enter a trade, anticipating that the price will continue in the direction established between Point A and Point B. The ABC trading pattern is confirmed when the price surpasses Point A.
Types of ABC Patterns
There are two primary types of ABC trading patterns: the bullish ABC trading pattern and the bearish ABC trading pattern.
- Bullish ABC Pattern: This pattern forms in an uptrend. Point A is a low, Point B is a high (retracement), and Point C is a higher low. Traders look to buy when the price breaks above Point A, anticipating a continuation of the uptrend.
- Bearish ABC Pattern: This pattern forms in a downtrend. Point A is a high, Point B is a low (retracement), and Point C is a lower high. Traders look to sell when the price breaks below Point A, anticipating a continuation of the downtrend.
Identifying the ABC Trading Pattern on a Chart
Identifying the ABC trading pattern requires careful observation and analysis of price charts. Here’s a step-by-step guide to help you spot this pattern:
- Identify a Significant Trend: Look for a clear uptrend or downtrend in the market. The ABC trading pattern is most effective when it forms within an established trend.
- Locate Point A: Identify a significant high or low that marks the beginning of the trend. This is your starting point.
- Find Point B (Retracement): Look for a retracement from Point A. This retracement should ideally fall between the 38.2% and 61.8% Fibonacci retracement levels of the distance from Point A. Use Fibonacci tools to accurately measure the retracement.
- Confirm Point C: Point C should be a continuation of the original trend after the retracement at Point B. It should form a higher low in a bullish pattern or a lower high in a bearish pattern.
- Validation: The ABC trading pattern is validated when the price breaks above Point A in a bullish pattern or below Point A in a bearish pattern.
Trading Strategies Using the ABC Pattern
Once you’ve identified an ABC trading pattern, you can use it to develop a trading strategy. Here are some common strategies:
Entry Points
- Bullish Pattern: Enter a long position when the price breaks above Point A. This confirms the continuation of the uptrend.
- Bearish Pattern: Enter a short position when the price breaks below Point A. This confirms the continuation of the downtrend.
Stop-Loss Orders
- Bullish Pattern: Place your stop-loss order below Point C. This protects your position in case the price reverses and the pattern fails.
- Bearish Pattern: Place your stop-loss order above Point C. This protects your position in case the price reverses and the pattern fails.
Take-Profit Targets
- Fibonacci Extension: Use Fibonacci extension levels to set your take-profit targets. Common targets include the 127.2% and 161.8% extension levels of the distance from Point A to Point B.
- Risk-Reward Ratio: Aim for a favorable risk-reward ratio, such as 1:2 or 1:3. This means that your potential profit should be at least twice or three times the amount you’re risking.
Combining with Other Indicators
To increase the reliability of the ABC trading pattern, consider combining it with other technical indicators, such as:
- Moving Averages: Use moving averages to confirm the overall trend direction. For example, in a bullish ABC trading pattern, the price should be trading above the moving average.
- Relative Strength Index (RSI): Use RSI to identify overbought or oversold conditions. This can help you avoid entering trades when the market is already extended.
- MACD (Moving Average Convergence Divergence): Use MACD to confirm the momentum of the trend. A bullish crossover in MACD can signal a potential buying opportunity in a bullish ABC trading pattern.
Limitations of the ABC Trading Pattern
While the ABC trading pattern can be a useful tool, it’s important to be aware of its limitations:
- Subjectivity: Identifying the ABC trading pattern can be subjective, as different traders may interpret the pattern differently. This can lead to inconsistent results.
- False Signals: The pattern can generate false signals, especially in volatile markets. The price may break above or below Point A, only to reverse shortly after.
- Time-Consuming: Identifying and validating the ABC trading pattern can be time-consuming, requiring careful analysis of price charts.
- Not a Holy Grail: The ABC trading pattern is not a foolproof strategy and should not be used in isolation. It’s important to combine it with other tools and techniques to improve its reliability.
Real-World Examples of ABC Trading Pattern
Let’s examine a few real-world examples to illustrate how the ABC trading pattern can be applied in different market conditions.
Example 1: Bullish ABC Pattern in a Stock
Imagine a stock is in an uptrend. The price makes a low at $50 (Point A), retraces to $52 (Point B), and then forms a higher low at $51 (Point C). If the price then breaks above $50, this confirms a bullish ABC trading pattern. A trader might enter a long position at $50 with a stop-loss order placed below $51.
Example 2: Bearish ABC Pattern in Forex
Consider a Forex pair in a downtrend. The price makes a high at 1.2000 (Point A), retraces to 1.1800 (Point B), and then forms a lower high at 1.1900 (Point C). If the price then breaks below 1.2000, this confirms a bearish ABC trading pattern. A trader might enter a short position at 1.2000 with a stop-loss order placed above 1.1900.
Tips for Trading the ABC Pattern
Here are some additional tips to help you trade the ABC trading pattern more effectively:
- Practice: Practice identifying the ABC trading pattern on historical price charts before trading it in live markets.
- Use a Demo Account: Test your trading strategy on a demo account to get a feel for how the pattern works in different market conditions.
- Manage Your Risk: Always use stop-loss orders to protect your capital. Don’t risk more than you can afford to lose on any single trade.
- Be Patient: Wait for the pattern to be confirmed before entering a trade. Don’t jump the gun.
- Stay Disciplined: Stick to your trading plan and avoid making impulsive decisions based on emotions.
Conclusion
The ABC trading pattern is a valuable tool for traders looking to identify potential buying or selling opportunities in the financial markets. By understanding its components, how to identify it, and how to develop trading strategies around it, you can improve your market timing and profitability. However, it’s important to be aware of its limitations and to combine it with other tools and techniques to increase its reliability. Remember to practice, manage your risk, and stay disciplined to achieve consistent results.
[See also: Fibonacci Retracement Trading Strategy]
[See also: Understanding Technical Analysis Indicators]
[See also: Risk Management in Forex Trading]
