Decoding the ABC Trading Pattern: A Comprehensive Guide
The ABC trading pattern is a popular and relatively simple chart pattern used by traders to identify potential buying or selling opportunities in various financial markets. Understanding this pattern can provide valuable insights into market trends and help traders make more informed decisions. This comprehensive guide will delve into the intricacies of the ABC trading pattern, exploring its components, variations, and how to effectively use it in your trading strategy. We’ll cover everything from identifying the pattern on a chart to setting appropriate entry and exit points, as well as risk management techniques.
Understanding the Core Components of the ABC Pattern
The ABC trading pattern, at its core, is a three-wave corrective pattern. These three waves are labeled as A, B, and C, and they represent specific price movements within a larger trend. Each wave plays a crucial role in defining the pattern and signaling potential trading opportunities.
- Wave A: This is the initial price movement in the opposite direction of the prevailing trend. It represents a correction or retracement of the existing trend.
- Wave B: This wave moves back in the direction of the original trend, partially retracing Wave A. It’s crucial to note that Wave B should not exceed the starting point of Wave A.
- Wave C: This is the final wave of the pattern, moving in the same direction as Wave A. It represents a continuation of the corrective movement and often extends beyond the end of Wave A.
The ABC pattern is characterized by these three distinct price swings. Identifying these waves accurately is the first step in utilizing this pattern for trading. The effectiveness of the ABC trading pattern relies heavily on the correct identification of these core components.
Identifying the ABC Pattern on a Chart
Identifying the ABC trading pattern on a chart requires careful observation and an understanding of price action. Traders look for a specific sequence of price movements that conform to the characteristics of the three waves. Here’s a step-by-step guide:
- Identify the Prevailing Trend: Determine the overall trend of the market. Is it an uptrend or a downtrend? The ABC pattern will typically form as a correction against this trend.
- Look for Wave A: Identify an initial price movement that goes against the prevailing trend. This is your potential Wave A.
- Confirm Wave B: Look for a retracement of Wave A, moving back in the direction of the original trend. Ensure that Wave B does not exceed the starting point of Wave A.
- Validate Wave C: Look for a final price movement in the same direction as Wave A, extending beyond the end of Wave A. This confirms the completion of the ABC trading pattern.
Practice is essential for accurately identifying the ABC trading pattern. Using historical data and charting tools can help you develop your pattern recognition skills. Many traders use technical indicators in conjunction with the ABC trading pattern to confirm their analysis. [See also: Using Technical Indicators for Pattern Confirmation]
Types of ABC Patterns: Bullish and Bearish
The ABC trading pattern can manifest in two main forms: bullish and bearish. The specific type of pattern will signal whether a potential buying or selling opportunity is present.
Bullish ABC Pattern
A bullish ABC trading pattern forms in a downtrend and suggests a potential reversal to the upside. In this scenario:
- Wave A is a downward movement.
- Wave B is an upward retracement of Wave A.
- Wave C is a downward movement that extends below the end of Wave A.
Traders often look to buy after the completion of Wave C, anticipating a continuation of the upward trend. The bullish ABC trading pattern is a strong signal for potential long positions.
Bearish ABC Pattern
A bearish ABC trading pattern forms in an uptrend and suggests a potential reversal to the downside. In this case:
- Wave A is an upward movement.
- Wave B is a downward retracement of Wave A.
- Wave C is an upward movement that extends above the end of Wave A.
Traders often look to sell after the completion of Wave C, anticipating a continuation of the downward trend. The bearish ABC trading pattern is a strong signal for potential short positions. Recognizing these variations of the ABC trading pattern is vital for successful trading.
Trading Strategies Using the ABC Pattern
Once you’ve identified an ABC trading pattern, the next step is to develop a trading strategy. This involves setting entry points, stop-loss orders, and take-profit targets. Here are some common strategies:
Entry Points
The most common entry point is after the completion of Wave C. For a bullish pattern, traders may enter a long position shortly after Wave C ends. For a bearish pattern, traders may enter a short position shortly after Wave C ends. Some traders use confirmation signals, such as candlestick patterns or technical indicators, to further validate their entry. [See also: Candlestick Patterns for Entry Confirmation]
Stop-Loss Orders
A stop-loss order is crucial for managing risk. It’s typically placed below the low of Wave C for a bullish pattern and above the high of Wave C for a bearish pattern. The specific placement will depend on your risk tolerance and the volatility of the market. Always use stop-loss orders when trading the ABC trading pattern.
Take-Profit Targets
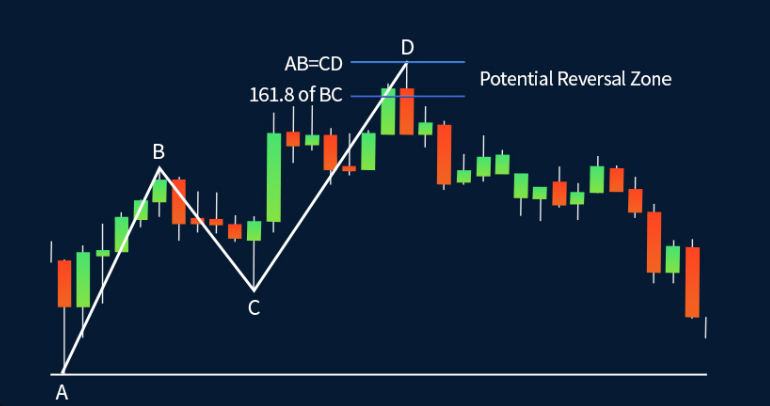
Take-profit targets can be determined using various methods, such as Fibonacci extensions or previous support and resistance levels. A common approach is to target a profit equal to the length of Wave A, projecting it from the end of Wave C. Adjust your take-profit target based on your risk-reward ratio and market conditions. The ABC trading pattern can provide clear targets for profit taking.
Combining the ABC Pattern with Fibonacci Retracements
Fibonacci retracements are a powerful tool that can be used in conjunction with the ABC trading pattern to identify potential support and resistance levels. By applying Fibonacci retracements to Wave A, traders can anticipate where Wave B might end and where Wave C might find support or resistance. Common Fibonacci levels to watch are 38.2%, 50%, and 61.8%. Using Fibonacci retracements with the ABC trading pattern can increase the accuracy of your trading decisions.
Risk Management Considerations
Effective risk management is paramount when trading any pattern, including the ABC trading pattern. Always use stop-loss orders to limit potential losses. Manage your position size to avoid risking too much capital on a single trade. Consider the overall market conditions and volatility before entering a trade. Remember that the ABC trading pattern, like all trading patterns, is not foolproof, and losses can occur. Proper risk management is essential for long-term success.
Limitations of the ABC Trading Pattern
While the ABC trading pattern can be a valuable tool, it’s important to be aware of its limitations. Not all ABC patterns are created equal, and some may be more reliable than others. False signals can occur, leading to losing trades. Market conditions can change rapidly, invalidating the pattern. It’s crucial to use the ABC trading pattern in conjunction with other technical analysis tools and indicators to confirm your analysis. Don’t rely solely on the ABC trading pattern for your trading decisions.
Real-World Examples of the ABC Trading Pattern
To further illustrate the application of the ABC trading pattern, let’s consider a few real-world examples. These examples will demonstrate how the pattern can be identified in different markets and timeframes. (Note: Specific chart examples with dates and asset names would be included here in a fully illustrated article, but are omitted for brevity.)
Example 1: A bullish ABC trading pattern forms in a stock during a period of consolidation. After the completion of Wave C, the stock price breaks out to the upside, confirming the pattern and providing a buying opportunity.
Example 2: A bearish ABC trading pattern forms in a currency pair during an uptrend. After the completion of Wave C, the currency pair reverses to the downside, confirming the pattern and providing a selling opportunity.
These examples highlight the versatility of the ABC trading pattern and its potential for generating profitable trades. Remember to always conduct thorough analysis and manage your risk accordingly.
Conclusion
The ABC trading pattern is a valuable tool for traders of all levels. By understanding its components, variations, and trading strategies, you can enhance your ability to identify potential buying and selling opportunities in the market. Remember to combine the ABC trading pattern with other technical analysis tools and indicators, and always practice proper risk management. With patience and diligence, you can effectively utilize the ABC trading pattern to improve your trading performance. Continue to learn and refine your skills to become a successful trader. The ABC trading pattern is just one piece of the puzzle, but it can be a powerful one when used correctly. Trading the ABC trading pattern requires discipline and a well-defined strategy. The ABC trading pattern is a popular chart formation. Mastering the ABC trading pattern takes time and dedication.
