Decoding the ABC Trading Pattern: A Comprehensive Guide for Traders
In the dynamic world of financial markets, traders constantly seek reliable patterns and strategies to identify potential opportunities and manage risk effectively. Among these, the ABC trading pattern stands out as a versatile and widely recognized formation. This article delves into the intricacies of the ABC trading pattern, providing a comprehensive guide for traders of all levels. We’ll explore its structure, variations, identification methods, and strategies for incorporating it into your trading arsenal. Understanding the ABC trading pattern can offer valuable insights into market trends and potential entry and exit points.
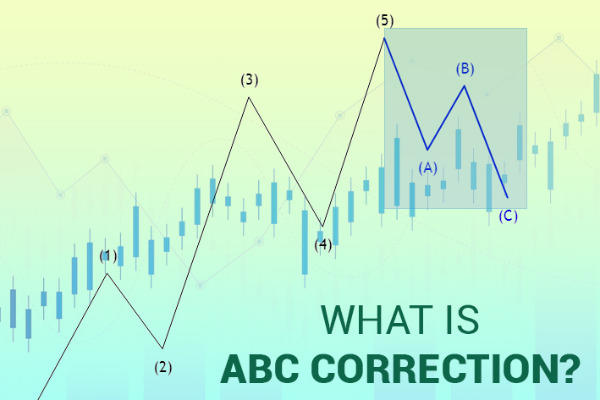
What is the ABC Trading Pattern?
The ABC trading pattern is a three-legged price movement that suggests a potential continuation or reversal of a trend. It’s a core concept in technical analysis and is often used to identify potential buying or selling opportunities. The pattern consists of three distinct points: A, B, and C. The movement from A to B represents the initial impulse leg, B to C is a correction, and the subsequent movement after C is the anticipated continuation or reversal.
The beauty of the ABC trading pattern lies in its simplicity and adaptability. It can be observed across various timeframes and asset classes, making it a valuable tool for both short-term and long-term traders. Recognizing and understanding the nuances of this pattern can significantly improve your trading decisions.
Understanding the Components of the ABC Pattern
To effectively identify and utilize the ABC trading pattern, it’s crucial to understand its individual components:
- Leg AB: This represents the initial price movement in the direction of the trend. It’s often a strong and decisive move that sets the stage for the subsequent correction.
- Leg BC: This is the corrective phase of the pattern, where the price retraces a portion of the AB leg. The depth of this retracement is a crucial factor in determining the validity and potential of the ABC trading pattern. Common retracement levels include 38.2%, 50%, and 61.8% Fibonacci levels.
- Point C: This point marks the end of the corrective phase and the potential resumption of the original trend or the beginning of a new trend. The price action around point C is closely monitored for confirmation signals.
Identifying the ABC Trading Pattern
Identifying the ABC trading pattern requires a keen eye and a solid understanding of price action. Here’s a step-by-step guide to help you spot this pattern on your charts:
- Identify a Trend: Start by identifying an existing uptrend or downtrend. The ABC trading pattern typically forms within the context of a larger trend.
- Look for the AB Leg: Identify a strong price movement in the direction of the trend. This will be your AB leg.
- Watch for a Correction (BC Leg): Observe the price action for a retracement against the AB leg. This correction should ideally fall within the Fibonacci retracement levels mentioned earlier (38.2%, 50%, or 61.8%).
- Confirm Point C: Look for signs of the price reversing its direction at point C. This could be indicated by candlestick patterns, momentum indicators, or volume confirmation.
Variations of the ABC Trading Pattern
While the basic structure of the ABC trading pattern remains consistent, there are several variations that traders should be aware of:
The ABC Correction in an Uptrend
In an uptrend, the AB leg will be a move upwards, followed by a BC leg which is a downward correction. Traders look to buy near point C, anticipating the continuation of the uptrend.
The ABC Correction in a Downtrend
Conversely, in a downtrend, the AB leg will be a move downwards, and the BC leg will be an upward correction. Traders look to sell near point C, expecting the downtrend to continue.
The Expanded ABC Pattern
In this variation, the BC leg retraces more than 100% of the AB leg. This can be a sign of a weakening trend and a potential reversal.
The Flat ABC Pattern
In a flat ABC pattern, the B point does not make a significant move, and the C point is roughly at the same level as the A point. This can often indicate a period of consolidation before a breakout.
Trading Strategies Using the ABC Pattern
Once you’ve identified an ABC trading pattern, the next step is to develop a trading strategy around it. Here are a few common strategies:
- Entry at Point C: This is the most straightforward approach. Enter a long position near point C in an uptrend or a short position near point C in a downtrend.
- Fibonacci Extensions: Use Fibonacci extensions to project potential price targets after point C. This can help you determine where to take profits.
- Stop-Loss Placement: Place your stop-loss order below point C in an uptrend or above point C in a downtrend. This helps to limit your potential losses if the pattern fails.
- Confirmation Signals: Look for confirmation signals, such as candlestick patterns or momentum indicators, before entering a trade. This can increase the probability of success.
Tools and Indicators to Enhance ABC Pattern Trading
Several tools and indicators can complement your ABC trading pattern analysis:
- Fibonacci Retracements: These are essential for identifying potential support and resistance levels during the BC leg.
- Moving Averages: Moving averages can help you identify the overall trend and confirm the direction of the AB leg.
- Relative Strength Index (RSI): The RSI can help you identify overbought or oversold conditions, which can signal potential reversals at point C.
- MACD (Moving Average Convergence Divergence): MACD can be used to confirm the momentum of the price movement after point C.
Risk Management Considerations
As with any trading strategy, risk management is paramount when trading the ABC trading pattern. Always use stop-loss orders to limit your potential losses. Consider your risk tolerance and adjust your position size accordingly. Avoid risking more than a small percentage of your trading capital on any single trade. Diversification is also key to mitigating risk across your portfolio.
Examples of ABC Trading Pattern in Real Markets
Let’s look at a couple of hypothetical examples to illustrate how the ABC trading pattern might appear in real market scenarios:
Example 1: Uptrend in Tech Stocks
Imagine a tech stock is trending upwards. The price moves from $100 (A) to $120 (B). It then retraces to $110 (C) before resuming its upward trajectory. A trader might enter a long position near $110, anticipating the continuation of the uptrend. They might place a stop-loss order just below $110 to limit potential losses.
Example 2: Downtrend in Forex
Consider a currency pair in a downtrend. The price falls from 1.2000 (A) to 1.1800 (B). It then retraces to 1.1900 (C) before resuming its downward movement. A trader could enter a short position near 1.1900, expecting the downtrend to continue. A stop-loss order could be placed just above 1.1900.
Common Mistakes to Avoid When Trading the ABC Pattern
While the ABC trading pattern can be a powerful tool, it’s essential to avoid common mistakes that can lead to losses:
- Ignoring the Overall Trend: Always trade the ABC trading pattern in the direction of the overall trend. Trading against the trend is generally riskier.
- Failing to Use Stop-Loss Orders: Stop-loss orders are crucial for limiting your potential losses. Never trade without them.
- Entering Too Early: Wait for confirmation signals before entering a trade. Don’t jump the gun before the pattern is fully formed.
- Overleveraging: Using too much leverage can magnify both your profits and your losses. Use leverage responsibly.
- Not Validating the Pattern: Ensure that the ABC pattern meets the necessary criteria, such as retracement levels and time duration, before considering a trade.
The Psychology Behind the ABC Pattern
Understanding the psychology behind the ABC trading pattern can provide further insights into its effectiveness. The AB leg represents the initial enthusiasm or fear driving the market. The BC leg is a period of doubt or consolidation, where traders question the sustainability of the initial move. Point C represents a crucial decision point where the market either confirms the original trend or reverses its course.
The ABC Pattern and Elliott Wave Theory
The ABC trading pattern is closely related to Elliott Wave Theory, which postulates that market prices move in specific patterns called waves. An ABC pattern often represents a corrective wave within a larger Elliott Wave sequence. Understanding the relationship between the ABC trading pattern and Elliott Wave Theory can provide a broader perspective on market movements. [See also: Elliott Wave Analysis]
Advanced Techniques for Trading the ABC Pattern
Experienced traders may employ advanced techniques to refine their ABC trading pattern strategies:
- Combining with Harmonic Patterns: Integrate the ABC pattern with harmonic patterns like Gartley or Butterfly patterns to identify high-probability trading opportunities.
- Time-Based Analysis: Analyze the time duration of each leg of the ABC pattern to gauge momentum and potential reversals.
- Volume Analysis: Incorporate volume data to confirm the strength of the AB leg and the validity of the reversal at point C.
Conclusion
The ABC trading pattern is a valuable tool for traders seeking to identify potential opportunities and manage risk effectively. By understanding its structure, variations, and trading strategies, you can incorporate this pattern into your trading arsenal and improve your decision-making process. Remember to always prioritize risk management and use confirmation signals to increase your probability of success. With practice and patience, the ABC trading pattern can become a reliable component of your trading strategy.
