Decoding the Adam and Eve Chart Pattern: A Comprehensive Guide
The Adam and Eve chart pattern is a powerful tool in technical analysis, offering insights into potential trend reversals and continuations. Understanding this pattern can significantly enhance a trader’s ability to make informed decisions. This comprehensive guide delves into the intricacies of the Adam and Eve chart pattern, exploring its formation, characteristics, trading strategies, and limitations.
What is the Adam and Eve Chart Pattern?
The Adam and Eve chart pattern is a double bottom or double top pattern recognized by its distinct V-shaped and rounded bottoms (or tops). It signals a potential reversal of a downtrend (or uptrend). The “Adam” portion is characterized by a sharp, narrow bottom or top, reflecting a quick price reversal. The “Eve” portion, on the other hand, features a wider, more rounded bottom or top, indicating a more gradual price consolidation. Identifying this pattern early can provide traders with a strategic advantage.
Key Characteristics of the Adam and Eve Pattern
- Adam: Sharp, V-shaped bottom (or top) with a quick price reversal.
- Eve: Rounded, wider bottom (or top) indicating price consolidation.
- Volume: Typically higher volume during the formation of the Adam section.
- Confirmation: Breakout above (or below) the neckline confirms the pattern.
Adam and Eve Double Bottom Pattern
The Adam and Eve double bottom pattern is a bullish reversal pattern that appears at the end of a downtrend. It suggests that the selling pressure is diminishing, and buyers are gaining control. Let’s break down the formation:
- Downtrend: The pattern begins with a clear downtrend, indicating sustained selling pressure.
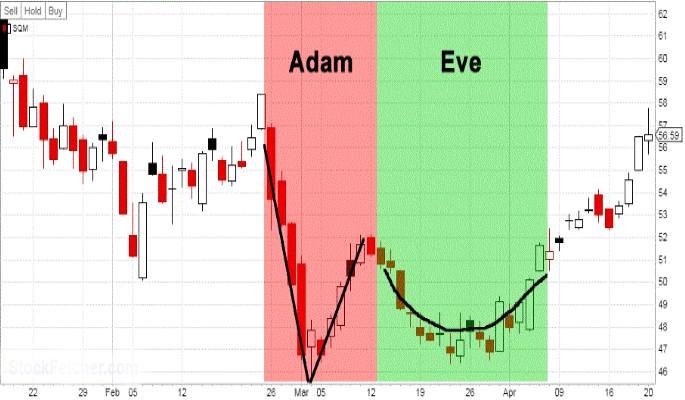
- Adam Bottom: A sharp, V-shaped bottom forms as the price rapidly declines and then quickly rebounds. This signifies a brief period of intense selling followed by immediate buying interest.
- Eve Bottom: A more rounded, U-shaped bottom forms after the Adam bottom. This indicates a period of consolidation where the price fluctuates within a narrow range before eventually rising.
- Neckline: The neckline is drawn by connecting the highest points between the Adam and Eve bottoms.
- Breakout: The pattern is confirmed when the price breaks above the neckline with increasing volume. This breakout signals a potential trend reversal and an opportunity to enter a long position.
Trading Strategies for the Adam and Eve Double Bottom
Several trading strategies can be employed when identifying an Adam and Eve double bottom pattern:
- Entry Point: Enter a long position after the price breaks above the neckline.
- Stop Loss: Place a stop-loss order below the Eve bottom to limit potential losses.
- Target Price: Calculate the target price by measuring the distance between the neckline and the bottom of the pattern, and then adding that distance to the neckline.
- Volume Confirmation: Ensure the breakout is accompanied by increasing volume to confirm the strength of the signal.
Adam and Eve Double Top Pattern
Conversely, the Adam and Eve double top pattern is a bearish reversal pattern that appears at the end of an uptrend. It suggests that the buying pressure is weakening, and sellers are taking control. The formation is as follows:
- Uptrend: The pattern begins with a clear uptrend, indicating sustained buying pressure.
- Adam Top: A sharp, V-shaped top forms as the price rapidly rises and then quickly declines. This signifies a brief period of intense buying followed by immediate selling pressure.
- Eve Top: A more rounded, inverted U-shaped top forms after the Adam top. This indicates a period of consolidation where the price fluctuates within a narrow range before eventually declining.
- Neckline: The neckline is drawn by connecting the lowest points between the Adam and Eve tops.
- Breakdown: The pattern is confirmed when the price breaks below the neckline with increasing volume. This breakdown signals a potential trend reversal and an opportunity to enter a short position.
Trading Strategies for the Adam and Eve Double Top
When trading the Adam and Eve double top pattern, consider these strategies:
- Entry Point: Enter a short position after the price breaks below the neckline.
- Stop Loss: Place a stop-loss order above the Eve top to limit potential losses.
- Target Price: Calculate the target price by measuring the distance between the neckline and the top of the pattern, and then subtracting that distance from the neckline.
- Volume Confirmation: Ensure the breakdown is accompanied by increasing volume to confirm the strength of the signal.
Identifying the Adam and Eve Chart Pattern
Successfully identifying the Adam and Eve chart pattern requires keen observation and attention to detail. Here are some tips:
- Look for Clear Trends: The pattern should form after a well-defined uptrend or downtrend.
- Distinguish Adam and Eve: Ensure the Adam portion is sharp and the Eve portion is rounded.
- Volume Analysis: Pay attention to volume during the formation and breakout/breakdown.
- Patience: Wait for confirmation before entering a trade to avoid false signals.
Advantages and Limitations of the Adam and Eve Pattern
Advantages
- Clear Entry and Exit Points: The pattern provides defined entry and exit points, making it easier to manage risk.
- High Probability: When confirmed with volume, the Adam and Eve chart pattern has a relatively high probability of success.
- Versatility: The pattern can be used in various markets and timeframes.
Limitations
- Subjectivity: Identifying the pattern can be subjective, leading to potential errors.
- False Signals: The pattern can produce false signals, especially in volatile markets.
- Time-Consuming: Waiting for confirmation can be time-consuming, and the opportunity may be missed.
Real-World Examples of the Adam and Eve Chart Pattern
To better understand the Adam and Eve chart pattern, let’s examine a couple of real-world examples.
Example 1: Suppose a stock is in a downtrend and forms a sharp V-shaped bottom (Adam) followed by a rounded U-shaped bottom (Eve). The price then breaks above the neckline with increasing volume. This confirms an Adam and Eve double bottom pattern, signaling a potential bullish reversal. Traders can enter a long position and set a target price based on the pattern’s height.
Example 2: Imagine a cryptocurrency is in an uptrend and forms a sharp V-shaped top (Adam) followed by a rounded inverted U-shaped top (Eve). The price then breaks below the neckline with increasing volume. This confirms an Adam and Eve double top pattern, signaling a potential bearish reversal. Traders can enter a short position and set a target price based on the pattern’s height.
Combining the Adam and Eve Pattern with Other Technical Indicators
To increase the reliability of the Adam and Eve chart pattern, it’s beneficial to combine it with other technical indicators. Here are a few examples:
- Moving Averages: Use moving averages to confirm the trend direction and identify potential support and resistance levels.
- Relative Strength Index (RSI): Use RSI to identify overbought or oversold conditions, which can provide additional confirmation of a reversal.
- MACD: Use MACD to identify potential trend changes and momentum shifts.
- Fibonacci Retracement: Use Fibonacci retracement levels to identify potential support and resistance levels, which can help set target prices.
Risk Management when Trading the Adam and Eve Pattern
Effective risk management is crucial when trading any chart pattern, including the Adam and Eve chart pattern. Here are some essential risk management techniques:
- Stop-Loss Orders: Always use stop-loss orders to limit potential losses. Place the stop-loss order at a level that invalidates the pattern if breached.
- Position Sizing: Determine the appropriate position size based on your risk tolerance and account size. Avoid risking too much capital on a single trade.
- Diversification: Diversify your portfolio to reduce the impact of any single trade or asset.
- Risk-Reward Ratio: Aim for a favorable risk-reward ratio, such as 1:2 or 1:3, to ensure that potential profits outweigh potential losses.
Advanced Strategies for Trading the Adam and Eve Pattern
For experienced traders, there are several advanced strategies that can be used to enhance the performance of the Adam and Eve chart pattern:
- Pattern Failure Analysis: Study instances where the pattern failed to identify common characteristics and avoid similar setups in the future.
- Time-Based Analysis: Consider the time it takes for the pattern to form. Longer formation periods may indicate stronger reversals.
- Contextual Analysis: Analyze the broader market context, including economic news and events, to assess the potential impact on the pattern.
The Psychology Behind the Adam and Eve Pattern
Understanding the psychology behind the Adam and Eve chart pattern can provide valuable insights into market behavior. The Adam portion reflects a period of intense emotional reactions, either panic selling or euphoric buying. The Eve portion represents a period of consolidation and uncertainty as market participants reassess their positions. The breakout or breakdown signifies a decisive shift in sentiment, as buyers or sellers gain control.
Conclusion
The Adam and Eve chart pattern is a valuable tool for technical analysts, offering insights into potential trend reversals and continuations. By understanding its formation, characteristics, and trading strategies, traders can enhance their ability to make informed decisions. However, it’s essential to remember that no chart pattern is foolproof, and effective risk management is crucial. Combining the Adam and Eve chart pattern with other technical indicators and conducting thorough analysis can significantly improve trading outcomes. Remember to always validate information through fact-checking and consult multiple sources before making any trading decisions. [See also: Understanding Chart Patterns in Forex Trading] [See also: The Ultimate Guide to Technical Analysis]. The Adam and Eve chart pattern, while a powerful indicator, should be used as part of a comprehensive trading strategy.
