
Decoding the Adam and Eve Chart Pattern: A Comprehensive Guide
The Adam and Eve chart pattern is a powerful technical analysis tool used by traders to identify potential reversals in the market. Characterized by its distinct ‘Adam’ and ‘Eve’ formations, this pattern can signal significant shifts in price direction. Understanding this pattern is crucial for traders looking to enhance their trading strategies and improve their decision-making process. This article provides a comprehensive overview of the Adam and Eve chart pattern, covering its formation, identification, trading strategies, and limitations. We’ll explore how to effectively use this pattern to navigate the complexities of financial markets.
Understanding Chart Patterns in Technical Analysis
Before diving into the specifics of the Adam and Eve chart pattern, it’s essential to grasp the role of chart patterns in technical analysis. Chart patterns are visual representations of price movements over a specific period, offering insights into market sentiment and potential future price movements. These patterns are formed by connecting price data points, such as highs, lows, and closing prices, to create recognizable shapes. Traders use these patterns to identify potential buying or selling opportunities.
Chart patterns can be broadly classified into two categories: reversal patterns and continuation patterns. Reversal patterns indicate a potential change in the prevailing trend, while continuation patterns suggest that the current trend is likely to continue. The Adam and Eve chart pattern falls under the category of reversal patterns, specifically signaling a potential bullish reversal after a downtrend.
What is the Adam and Eve Chart Pattern?
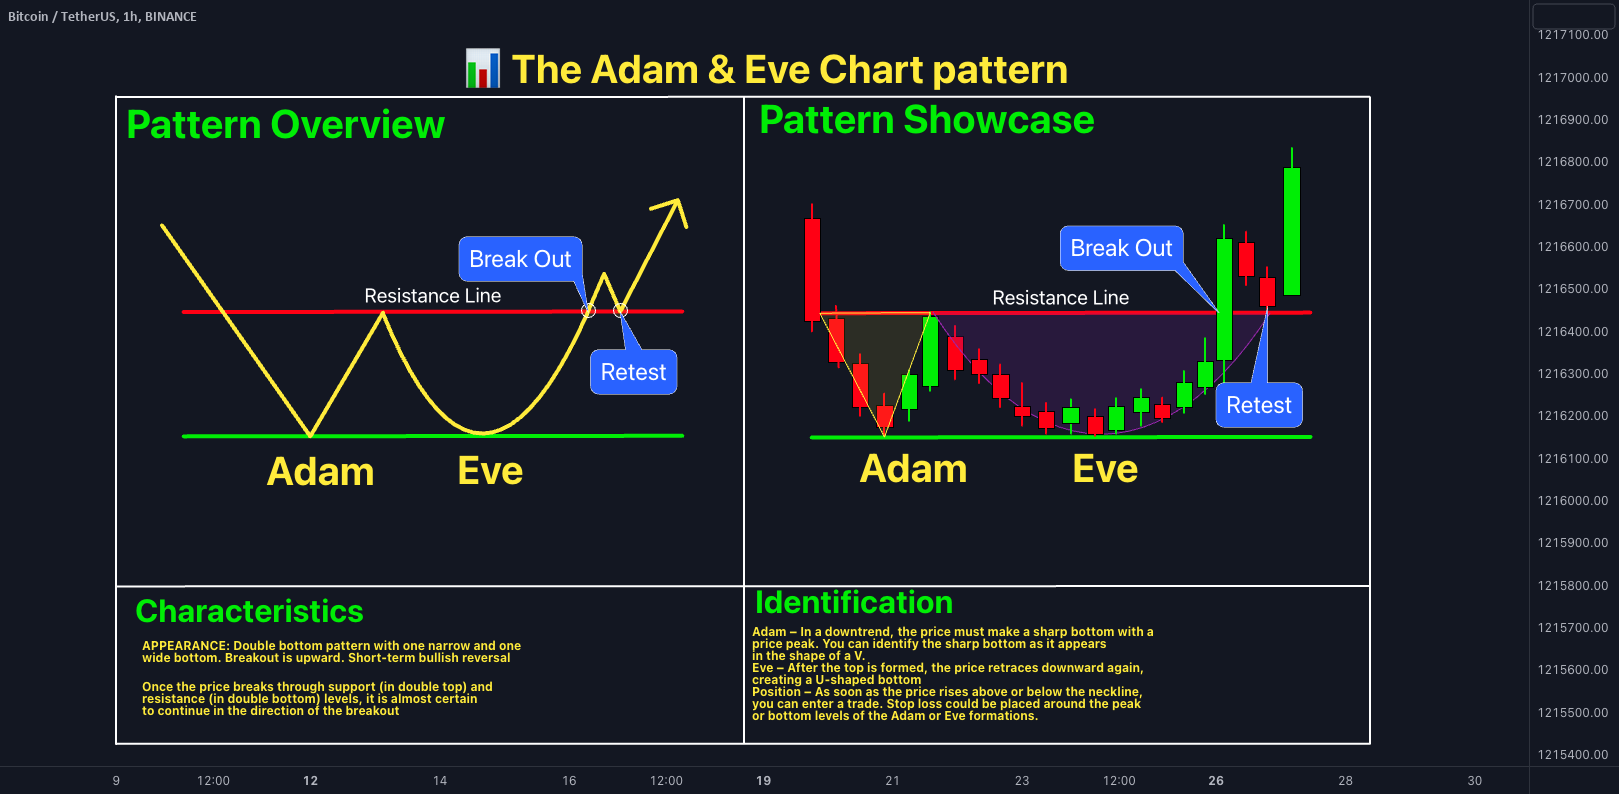
The Adam and Eve chart pattern is a bullish reversal pattern characterized by two distinct troughs: the ‘Adam’ trough and the ‘Eve’ trough. The ‘Adam’ trough is typically sharp and narrow, indicating a rapid price decline followed by a quick recovery. In contrast, the ‘Eve’ trough is wider and more rounded, suggesting a more gradual price decline and recovery. The pattern is completed when the price breaks above the highest point between the two troughs, known as the neckline.
Key Characteristics of the Adam Formation
- Sharp, Narrow Trough: The ‘Adam’ trough is characterized by a rapid price decline followed by an equally rapid recovery. This sharp V-shaped formation indicates strong selling pressure followed by a swift return of buying interest.
- High Volume: The ‘Adam’ trough often occurs with high trading volume, confirming the intensity of the selling pressure.
- Quick Recovery: The price recovers quickly after reaching the bottom of the ‘Adam’ trough, suggesting that buyers are eager to step in and capitalize on the lower prices.
Key Characteristics of the Eve Formation
- Wide, Rounded Trough: The ‘Eve’ trough is wider and more rounded compared to the ‘Adam’ trough. This formation indicates a more gradual price decline and recovery.
- Lower Volume: The ‘Eve’ trough typically occurs with lower trading volume compared to the ‘Adam’ trough, suggesting less intense selling pressure.
- Gradual Recovery: The price recovers more gradually after reaching the bottom of the ‘Eve’ trough, reflecting a more cautious return of buying interest.
Identifying the Adam and Eve Chart Pattern
Identifying the Adam and Eve chart pattern requires careful observation and attention to detail. Here are the key steps to identify this pattern on a price chart:
- Identify a Downtrend: The Adam and Eve chart pattern typically forms after a downtrend. Look for a series of lower highs and lower lows, indicating that the price is moving downward.
- Locate the Adam Trough: Look for a sharp, narrow trough characterized by a rapid price decline and recovery. This is the ‘Adam’ formation.
- Find the Eve Trough: Identify a wider, more rounded trough that follows the ‘Adam’ trough. This is the ‘Eve’ formation.
- Draw the Neckline: Draw a horizontal line connecting the highest points between the ‘Adam’ and ‘Eve’ troughs. This line serves as the neckline, and a break above this line confirms the pattern.
- Confirm the Breakout: Wait for the price to break above the neckline with significant trading volume. This breakout confirms the pattern and signals a potential bullish reversal.
Trading Strategies Using the Adam and Eve Chart Pattern
Once you have identified the Adam and Eve chart pattern, you can use it to develop effective trading strategies. Here are some common trading strategies used by traders:
Entry Point
The most common entry point is when the price breaks above the neckline. Traders often wait for a confirmed breakout, where the price closes above the neckline with significant trading volume. This confirmation helps to reduce the risk of false breakouts. Some traders also look for a pullback to the neckline after the breakout, which can provide a lower-risk entry point.
Stop-Loss Placement
Proper stop-loss placement is crucial for managing risk. A common strategy is to place the stop-loss order below the lowest point of the ‘Eve’ trough. This placement helps to protect against potential downside risk if the pattern fails. Another strategy is to place the stop-loss order below the neckline, providing a tighter stop-loss but potentially increasing the risk of being stopped out prematurely.
Profit Target
Determining the profit target involves estimating the potential upside of the pattern. A common method is to measure the vertical distance between the lowest point of the ‘Eve’ trough and the neckline. This distance is then added to the breakout point above the neckline to determine the profit target. For example, if the distance between the ‘Eve’ trough and the neckline is $10, and the price breaks out above the neckline at $50, the profit target would be $60.
Example of an Adam and Eve Chart Pattern Trade
Let’s consider a hypothetical example to illustrate how to trade the Adam and Eve chart pattern. Suppose you identify an Adam and Eve chart pattern forming in the stock of XYZ Company. The ‘Adam’ trough forms at $40, followed by an ‘Eve’ trough at $42. The neckline is at $50. You wait for the price to break above the neckline with significant trading volume.
Once the price breaks above $50, you enter a long position. You place your stop-loss order below the ‘Eve’ trough at $41. Based on the measurement between the ‘Eve’ trough and the neckline ($50 – $42 = $8), you set your profit target at $58 ($50 + $8). If the price reaches your profit target, you close your position and realize a profit. If the price falls below your stop-loss, you exit the trade to limit your losses.
Limitations of the Adam and Eve Chart Pattern
While the Adam and Eve chart pattern can be a valuable tool, it’s essential to be aware of its limitations. Like all technical analysis tools, it’s not foolproof and can generate false signals. Here are some common limitations:
- Subjectivity: Identifying the Adam and Eve chart pattern can be subjective, as different traders may interpret the pattern differently. This subjectivity can lead to inconsistent trading decisions.
- False Breakouts: The price may break above the neckline but then reverse direction, resulting in a false breakout. This can lead to losses if you enter a trade based on the breakout.
- Market Conditions: The effectiveness of the Adam and Eve chart pattern can vary depending on market conditions. It may be more reliable in trending markets than in choppy or sideways markets.
- Time Frame: The time frame in which the pattern is observed can affect its reliability. Longer time frames, such as daily or weekly charts, tend to produce more reliable signals than shorter time frames, such as hourly or 15-minute charts.
Tips for Trading the Adam and Eve Chart Pattern
To improve your success rate when trading the Adam and Eve chart pattern, consider the following tips:
- Use Confirmation: Always wait for confirmation before entering a trade. Look for a confirmed breakout above the neckline with significant trading volume.
- Combine with Other Indicators: Use the Adam and Eve chart pattern in conjunction with other technical indicators, such as moving averages, RSI, and MACD, to confirm your trading decisions.
- Manage Risk: Always use proper stop-loss orders to manage your risk. Place your stop-loss order below the ‘Eve’ trough or the neckline, depending on your risk tolerance.
- Practice: Practice identifying and trading the Adam and Eve chart pattern on historical data before trading with real money. This will help you to develop your skills and confidence.
- Stay Informed: Stay informed about market news and events that could affect the price of the asset you are trading.
Adam and Eve Pattern Variations
While the classic Adam and Eve chart pattern is widely recognized, there are variations of the pattern that traders should be aware of. These variations can offer additional insights into potential price movements and can be used to refine trading strategies.
Double Adam Pattern
The Double Adam pattern involves two consecutive Adam formations before the Eve formation. This pattern suggests increased selling pressure and a potentially stronger bullish reversal once the neckline is broken.
Adam and Eve with a Handle
Similar to the cup and handle pattern, the Adam and Eve pattern can sometimes form with a handle. The handle is a small consolidation pattern that forms after the Eve formation but before the breakout. The handle indicates a period of price consolidation before the upward movement, suggesting a more sustainable breakout.
The Psychology Behind the Adam and Eve Pattern
Understanding the psychology behind the Adam and Eve chart pattern can provide a deeper insight into the market dynamics that drive the pattern’s formation. The pattern reflects the shifting balance between buyers and sellers in the market.
The Adam formation represents a period of intense selling pressure, driven by fear and uncertainty. The sharp price decline indicates that sellers are in control, pushing the price down rapidly. However, the quick recovery suggests that buyers are starting to see value at the lower prices and are stepping in to buy.
The Eve formation represents a period of consolidation, where the selling pressure subsides, and the market searches for a new equilibrium. The wider, rounded trough indicates a more gradual decline and recovery, suggesting that buyers and sellers are more evenly matched. The breakout above the neckline signals that buyers have gained control, and the market is poised for a bullish reversal.
By understanding the psychology behind the Adam and Eve chart pattern, traders can gain a better understanding of the market dynamics and make more informed trading decisions.
Conclusion
The Adam and Eve chart pattern is a valuable tool for identifying potential bullish reversals in the market. By understanding its formation, identification, trading strategies, and limitations, traders can enhance their trading strategies and improve their decision-making process. While the pattern is not foolproof, it can provide valuable insights into market sentiment and potential future price movements. Remember to use confirmation, combine with other indicators, manage risk, and practice before trading with real money. With a solid understanding of the Adam and Eve chart pattern, you can navigate the complexities of financial markets with greater confidence. [See also: Understanding Reversal Patterns in Trading] [See also: Advanced Technical Analysis Techniques] [See also: Risk Management Strategies for Traders]
