Decoding the Adam and Eve Chart Pattern: A Comprehensive Guide
The Adam and Eve chart pattern is a reversal pattern used in technical analysis to predict potential bullish trend reversals. Identifying and understanding this pattern can provide traders with valuable insights into market sentiment and potential profit opportunities. This guide will delve into the intricacies of the Adam and Eve chart pattern, exploring its formation, characteristics, identification, and trading strategies.
What is the Adam and Eve Chart Pattern?
The Adam and Eve chart pattern is characterized by two distinct rounded bottoms. The ‘Adam’ bottom is sharp and narrow, often formed by a quick, volatile price decline and rebound. In contrast, the ‘Eve’ bottom is wider and more rounded, representing a period of consolidation before a potential upward move. This pattern suggests a shift from bearish to bullish momentum. Recognizing the Adam and Eve chart pattern early can provide a significant advantage in trading.
Key Characteristics of the Adam and Eve Pattern
To accurately identify the Adam and Eve chart pattern, several key characteristics must be considered:
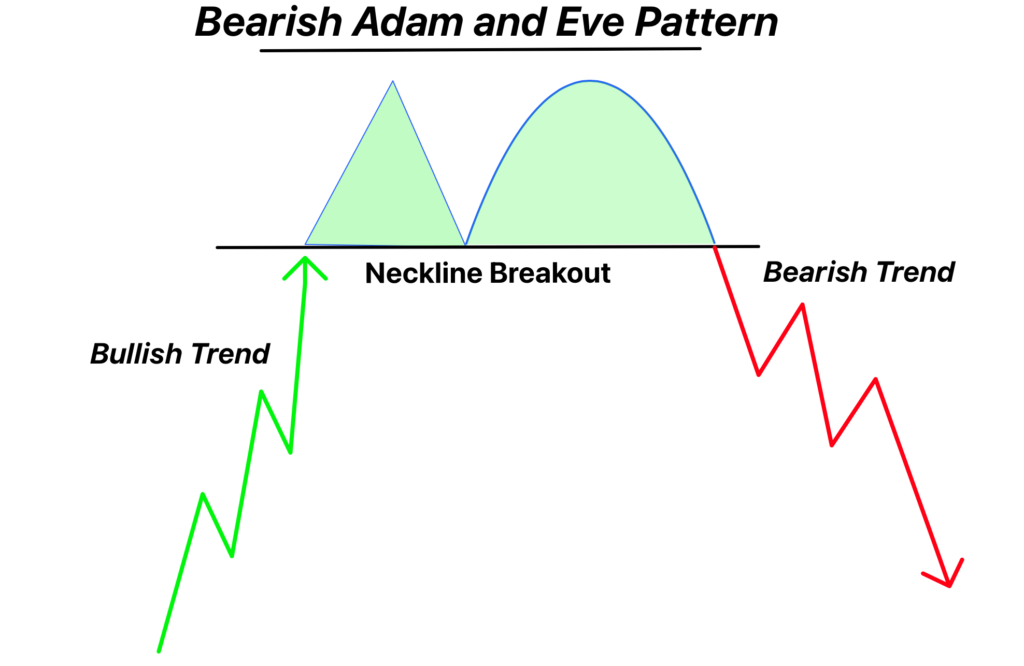
- Adam Bottom: A sharp, narrow bottom with a V-shape formation, indicating a rapid price reversal.
- Eve Bottom: A wider, more rounded bottom, suggesting a period of consolidation and indecision in the market.
- Neckline: A resistance level formed by the highs between the Adam and Eve bottoms. A break above this neckline confirms the pattern.
- Volume: Typically, volume decreases during the formation of the bottoms and increases significantly upon the breakout above the neckline.
Understanding these characteristics is crucial for distinguishing the Adam and Eve chart pattern from other chart patterns.
Identifying the Adam and Eve Chart Pattern
Identifying the Adam and Eve chart pattern requires careful observation and analysis of price charts. Here’s a step-by-step guide:
- Look for a Downtrend: The pattern typically forms after a period of price decline.
- Identify the Adam Bottom: Observe a sharp, narrow bottom with a V-shape recovery.
- Identify the Eve Bottom: Look for a wider, rounded bottom following the Adam bottom.
- Draw the Neckline: Connect the highs between the Adam and Eve bottoms to form a resistance level.
- Confirm the Breakout: Wait for the price to break above the neckline with increasing volume.
Confirming the breakout is essential to avoid false signals. The Adam and Eve chart pattern is a powerful indicator when identified correctly.
Trading Strategies for the Adam and Eve Chart Pattern
Once the Adam and Eve chart pattern is identified and confirmed, traders can employ various strategies to capitalize on the potential upward move:
Entry Points
- Breakout Entry: Enter a long position when the price breaks above the neckline with strong volume.
- Retest Entry: Wait for the price to retest the neckline (now acting as support) after the breakout before entering a long position. This approach can offer a more conservative entry.
Setting Stop-Loss Orders
- Below the Eve Bottom: Place the stop-loss order slightly below the low of the Eve bottom to protect against potential false breakouts.
- Below the Neckline: For a more aggressive approach, place the stop-loss order just below the neckline after the breakout.
Setting Profit Targets
- Measured Move: Calculate the distance between the bottom of the Eve bottom and the neckline. Project this distance upwards from the breakout point to determine the potential profit target.
- Resistance Levels: Identify significant resistance levels above the neckline and set profit targets accordingly.
Effective risk management is crucial when trading the Adam and Eve chart pattern. Always use stop-loss orders to limit potential losses.
Adam and Eve vs. Double Bottom Pattern
While the Adam and Eve chart pattern resembles the double bottom pattern, there are key differences. The double bottom pattern typically features two bottoms of similar shape and duration. In contrast, the Adam and Eve pattern has distinct bottoms – one sharp and narrow (Adam) and the other wide and rounded (Eve). Understanding these differences is essential for accurate pattern recognition.
Real-World Examples of the Adam and Eve Chart Pattern
To illustrate the effectiveness of the Adam and Eve chart pattern, let’s examine a few real-world examples.
Example 1: Stock XYZ
In the daily chart of Stock XYZ, an Adam and Eve chart pattern formed after a prolonged downtrend. The ‘Adam’ bottom was characterized by a sharp decline and rapid recovery, while the ‘Eve’ bottom showed a wider, more gradual consolidation. After the price broke above the neckline with increased volume, the stock experienced a significant upward move, validating the pattern.
Example 2: Cryptocurrency ABC
The 4-hour chart of Cryptocurrency ABC also displayed an Adam and Eve chart pattern. The pattern formed after a bearish trend, with the ‘Adam’ bottom showing a quick price reversal and the ‘Eve’ bottom indicating a period of stabilization. A breakout above the neckline led to a substantial price increase, confirming the bullish reversal.
These examples highlight the potential of the Adam and Eve chart pattern to identify profitable trading opportunities.
Advantages and Limitations
Advantages
- High Probability: The Adam and Eve chart pattern is considered a high-probability reversal pattern when identified correctly.
- Clear Entry and Exit Points: The neckline provides a clear breakout point for entry, and the Eve bottom offers a logical place for stop-loss orders.
- Defined Profit Targets: The measured move technique allows traders to set realistic profit targets.
Limitations
- False Breakouts: Like all chart patterns, the Adam and Eve chart pattern is susceptible to false breakouts. Confirmation through volume analysis is crucial.
- Subjectivity: Identifying the pattern can be subjective, requiring experience and careful observation.
- Time-Consuming: Waiting for the pattern to fully form and confirm can be time-consuming, requiring patience.
Despite these limitations, the Adam and Eve chart pattern remains a valuable tool for technical analysts.
Tips for Trading the Adam and Eve Pattern
To maximize the effectiveness of the Adam and Eve chart pattern, consider the following tips:
- Confirm with Volume: Always confirm the breakout with increased volume to reduce the risk of false signals.
- Use Multiple Timeframes: Analyze the pattern on multiple timeframes to gain a comprehensive view of the market.
- Combine with Other Indicators: Use other technical indicators, such as moving averages and oscillators, to confirm the pattern and improve accuracy.
- Practice Risk Management: Always use stop-loss orders and manage your position size to limit potential losses.
By following these tips, traders can enhance their ability to profit from the Adam and Eve chart pattern.
Conclusion
The Adam and Eve chart pattern is a powerful reversal pattern that can provide traders with valuable insights into potential bullish trend reversals. By understanding its formation, characteristics, and trading strategies, traders can improve their ability to identify profitable opportunities. While the pattern has limitations, its high probability and defined entry and exit points make it a valuable tool for technical analysts. Always confirm the pattern with volume analysis and combine it with other indicators to enhance accuracy. With careful observation, patience, and effective risk management, the Adam and Eve chart pattern can be a valuable addition to any trader’s toolkit. Remember to always validate your trading decisions with thorough analysis and consider consulting with a financial advisor.
[See also: Understanding Chart Patterns in Technical Analysis]
[See also: Advanced Trading Strategies for Beginners]
[See also: Risk Management in Forex Trading]
