Decoding the Adam and Eve Pattern: A Comprehensive Guide for Traders
The Adam and Eve pattern is a popular chart pattern used in technical analysis to identify potential trend reversals. This pattern, characterized by its distinct ‘Adam’ and ‘Eve’ formations, can provide valuable insights into market sentiment and potential price movements. Understanding the nuances of the Adam and Eve pattern is crucial for traders looking to enhance their decision-making process and improve their trading strategies.
What is the Adam and Eve Pattern?
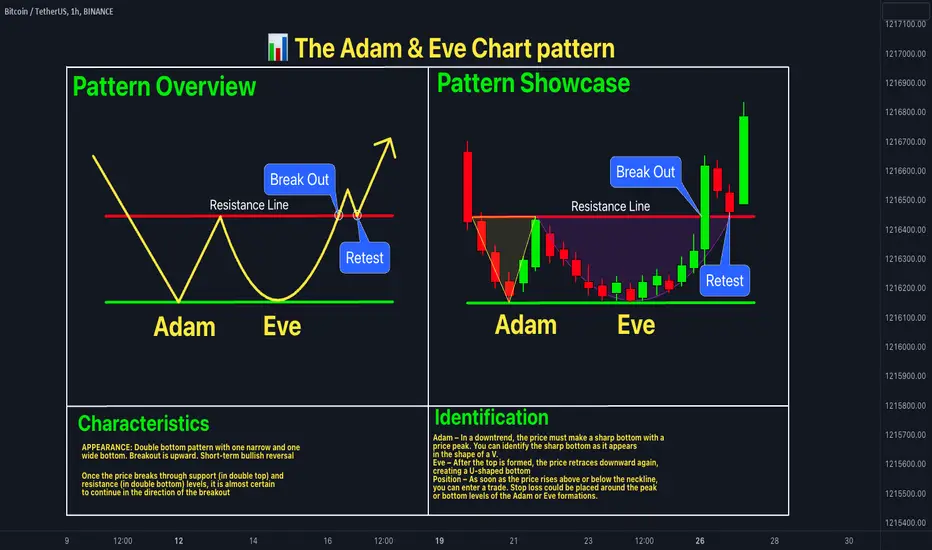
The Adam and Eve pattern is a double bottom or double top formation that signals a potential reversal in the market. It consists of two distinct bottoms (in the case of a bullish reversal) or tops (in the case of a bearish reversal). The “Adam” bottom or top is typically sharp and narrow, often characterized by a V-shaped formation. The “Eve” bottom or top, on the other hand, is wider, rounder, and more gradual, resembling a saucer-like shape. Recognizing this pattern early can give traders a significant advantage.
Key Characteristics of the Adam and Eve Pattern
- Adam Bottom/Top: Sharp, narrow price action, often V-shaped.
- Eve Bottom/Top: Wider, rounder price action, resembling a saucer.
- Volume: Typically lower during the formation of Eve compared to Adam.
- Confirmation: A breakout above the neckline (for bullish reversal) or below the neckline (for bearish reversal).
Bullish Adam and Eve Pattern: A Detailed Look
The bullish Adam and Eve pattern, also known as the Adam and Eve double bottom, signals a potential upward trend reversal. This pattern forms after a downtrend, indicating that the selling pressure is diminishing and buyers are stepping in. The “Adam” formation is a sharp, quick drop followed by a quick recovery, creating a V-shaped bottom. The “Eve” formation is a more gradual decline and recovery, forming a rounded bottom. The subsequent breakout above the neckline confirms the pattern and suggests a potential bullish move.
Identifying a Bullish Adam and Eve Pattern
- Prior Downtrend: The pattern should form after a clear downtrend.
- Adam Formation: Look for a sharp, V-shaped bottom.
- Eve Formation: Look for a wider, rounded bottom.
- Neckline: Identify the resistance level formed by the highs between the two bottoms.
- Breakout: A break above the neckline on increasing volume confirms the pattern.
Trading the Bullish Adam and Eve Pattern
Once you’ve identified a bullish Adam and Eve pattern and confirmed the breakout, you can consider entering a long position. A common strategy is to place a buy order just above the neckline after a confirmed breakout. The stop-loss order can be placed just below the most recent swing low (usually the low of the Eve formation). The target price can be estimated by measuring the distance from the bottom of the pattern to the neckline and projecting that distance upward from the breakout point.
Bearish Adam and Eve Pattern: A Detailed Look
The bearish Adam and Eve pattern, also known as the Adam and Eve double top, signals a potential downward trend reversal. This pattern forms after an uptrend, indicating that the buying pressure is diminishing and sellers are taking control. The “Adam” formation is a sharp, quick rise followed by a quick decline, creating an inverted V-shaped top. The “Eve” formation is a more gradual rise and decline, forming a rounded top. The subsequent breakout below the neckline confirms the pattern and suggests a potential bearish move. Understanding this pattern is vital for short-selling opportunities.
Identifying a Bearish Adam and Eve Pattern
- Prior Uptrend: The pattern should form after a clear uptrend.
- Adam Formation: Look for a sharp, inverted V-shaped top.
- Eve Formation: Look for a wider, rounded top.
- Neckline: Identify the support level formed by the lows between the two tops.
- Breakdown: A break below the neckline on increasing volume confirms the pattern.
Trading the Bearish Adam and Eve Pattern
Once you’ve identified a bearish Adam and Eve pattern and confirmed the breakdown, you can consider entering a short position. A common strategy is to place a sell order just below the neckline after a confirmed breakdown. The stop-loss order can be placed just above the most recent swing high (usually the high of the Eve formation). The target price can be estimated by measuring the distance from the top of the pattern to the neckline and projecting that distance downward from the breakdown point.
Volume Analysis in the Adam and Eve Pattern
Volume plays a crucial role in confirming the validity of the Adam and Eve pattern. Ideally, the volume should be lower during the formation of the “Eve” compared to the “Adam.” This indicates that the momentum is slowing down as the pattern develops. Furthermore, a significant increase in volume during the breakout or breakdown of the neckline strengthens the signal and increases the probability of a successful trade. Always consider volume as a key indicator.
Adam and Eve Pattern vs. Other Chart Patterns
While the Adam and Eve pattern is a valuable tool, it’s important to differentiate it from other chart patterns, such as the double bottom/top, head and shoulders, and cup and handle. The key difference lies in the shape and formation of the bottoms or tops. The Adam and Eve pattern has distinct V-shaped and rounded formations, while other patterns may have different characteristics. Comparing and contrasting these patterns can improve your overall trading accuracy. [See also: Double Bottom vs Double Top: Key Differences]
Real-World Examples of the Adam and Eve Pattern
The Adam and Eve pattern can be observed in various markets, including stocks, forex, and commodities. Let’s consider a hypothetical example in the stock market. Suppose a stock has been in a downtrend for several months. It then forms a sharp V-shaped bottom (Adam) followed by a wider, rounded bottom (Eve). If the stock breaks above the neckline on increasing volume, it confirms the bullish Adam and Eve pattern, signaling a potential upward move. Analyzing real-world examples can help solidify your understanding of the pattern.
Limitations of the Adam and Eve Pattern
Like any technical analysis tool, the Adam and Eve pattern has its limitations. It’s not always accurate and can sometimes produce false signals. It’s crucial to use other indicators and analysis techniques to confirm the validity of the pattern. Additionally, market conditions and news events can influence price movements and invalidate the pattern. Always manage your risk and use stop-loss orders to protect your capital. Relying solely on the Adam and Eve pattern without considering other factors can lead to inaccurate trading decisions.
Tips for Trading the Adam and Eve Pattern Successfully
- Confirmation is Key: Always wait for a confirmed breakout or breakdown before entering a trade.
- Volume Analysis: Pay attention to volume during the formation and breakout of the pattern.
- Use Other Indicators: Combine the Adam and Eve pattern with other technical indicators, such as RSI, MACD, and moving averages.
- Risk Management: Always use stop-loss orders to protect your capital.
- Patience: Wait for the right setup and avoid forcing trades.
Conclusion
The Adam and Eve pattern is a powerful tool for identifying potential trend reversals in the market. By understanding the key characteristics, identifying the pattern correctly, and using appropriate trading strategies, traders can enhance their decision-making process and improve their trading performance. However, it’s important to remember that the pattern is not foolproof and should be used in conjunction with other analysis techniques and risk management strategies. Mastering the Adam and Eve pattern can be a valuable asset in your trading arsenal. This pattern offers insights that can significantly improve your trading strategy.
