Decoding the Double Doji: A Comprehensive Guide to Understanding This Powerful Candlestick Pattern
In the dynamic world of financial markets, traders and investors constantly seek reliable indicators to predict future price movements. Among the various tools available, candlestick patterns hold a prominent position, offering visual representations of price action over specific periods. One such pattern, the double doji, can provide valuable insights into market sentiment and potential trend reversals. This article delves deep into the intricacies of the double doji pattern, exploring its formation, interpretation, limitations, and practical applications in trading strategies.
What is a Doji Candlestick Pattern?
Before diving into the complexities of the double doji, it’s crucial to understand the fundamental building block: the single doji candlestick. A doji is characterized by a small body, indicating that the opening and closing prices for the period are virtually equal. This signifies indecision in the market, where neither buyers nor sellers are in control. The length of the upper and lower shadows (the lines extending above and below the body) can vary, reflecting the price range during the period. A doji suggests a potential shift in momentum and often appears at the end of trends or during periods of consolidation.
Understanding the Double Doji Pattern
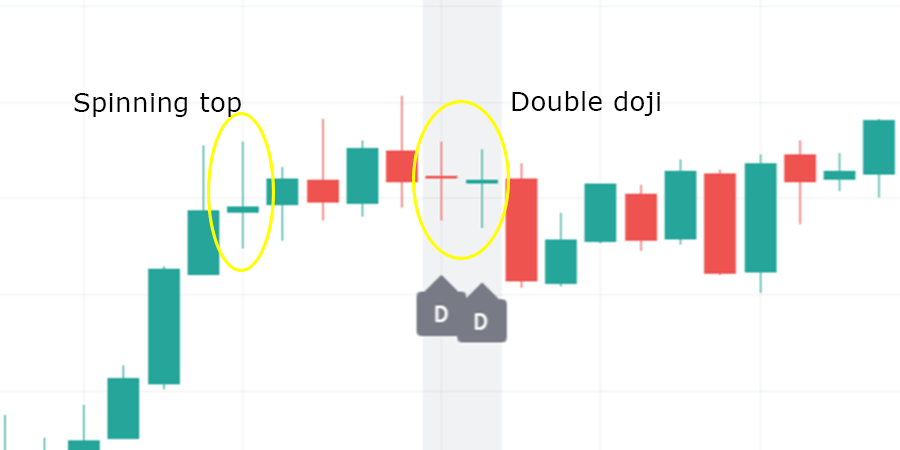
The double doji pattern occurs when two doji candlesticks appear consecutively on a price chart. This amplifies the signal of indecision and uncertainty in the market. The appearance of a double doji suggests that the equilibrium between buyers and sellers is particularly fragile, and a significant price movement may be imminent. The market is essentially waiting for a catalyst or a decisive force to break the stalemate.
Formation of the Double Doji
The double doji formation requires two consecutive trading periods to meet the criteria of a doji candlestick. These criteria include:
- Small body: The difference between the opening and closing prices should be minimal.
- Long or short shadows: The length of the shadows is less important than the small body.
- Consecutive occurrence: Two doji patterns must appear one after the other.
The color of the doji bodies (whether bullish or bearish) is generally not considered significant in the double doji pattern. The primary focus is on the indecision represented by the small bodies.
Interpreting the Double Doji: What Does It Tell Us?
The double doji pattern primarily signals indecision and potential trend reversal. However, the specific interpretation can vary depending on the context in which it appears:
Potential Trend Reversal
When a double doji forms after a prolonged uptrend or downtrend, it can indicate that the trend is losing momentum and a reversal may be on the horizon. Traders should look for confirmation from subsequent price action to validate the reversal signal. [See also: Identifying Trend Reversal Patterns]
Continuation Signal (Less Common)
In some cases, a double doji can act as a continuation signal, especially if it forms within a consolidation range. This suggests that the market is pausing before resuming the previous trend. However, this interpretation is less common than the reversal signal.
Increased Volatility
The appearance of a double doji often precedes a period of increased volatility. The indecision represented by the pattern suggests that the market is poised for a significant move in either direction. Traders should be prepared for wider price swings and potential whipsaws.
Types of Doji Candlestick Patterns
While the core concept of a doji remains the same, there are several variations, each with slightly different implications:
- Long-Legged Doji: This doji has long upper and lower shadows, indicating significant price fluctuation during the period but ultimately closing near the opening price.
- Dragonfly Doji: This doji has a long lower shadow and no upper shadow, resembling a dragonfly. It is generally considered a bullish reversal signal when it appears at the bottom of a downtrend.
- Gravestone Doji: This doji has a long upper shadow and no lower shadow, resembling a gravestone. It is generally considered a bearish reversal signal when it appears at the top of an uptrend.
- Four Price Doji: This doji has no shadows, meaning the open, high, low, and close prices are all the same. It is a rare occurrence and signifies extreme indecision.
Understanding these different types of doji patterns can enhance your interpretation of the double doji formation.
Trading Strategies Using the Double Doji
The double doji pattern can be incorporated into various trading strategies. Here are a few examples:
Confirmation is Key
Never trade solely based on the double doji pattern. Always seek confirmation from other indicators or price action. This could include waiting for a breakout above or below the high/low of the double doji formation, or looking for confirmation from oscillators like the RSI or MACD. A confirmed move after a double doji pattern provides a higher probability trade setup.
Breakout Trading
One common strategy is to wait for a breakout above the high of the double doji formation for a long entry, or a breakdown below the low for a short entry. Place a stop-loss order just below the low (for long entries) or just above the high (for short entries) to manage risk. [See also: Effective Breakout Trading Strategies]
Using with Support and Resistance
The effectiveness of the double doji pattern is enhanced when it appears at key support or resistance levels. A double doji forming at a resistance level after an uptrend is a strong bearish signal. Conversely, a double doji forming at a support level after a downtrend is a strong bullish signal.
Combining with Other Candlestick Patterns
The double doji can be used in conjunction with other candlestick patterns to refine your trading decisions. For example, if a double doji is followed by a bullish engulfing pattern, it strengthens the bullish reversal signal.
Limitations of the Double Doji Pattern
While the double doji pattern can be a valuable tool, it’s essential to be aware of its limitations:
- False Signals: Like all technical indicators, the double doji is not infallible and can generate false signals.
- Subjectivity: Identifying doji patterns can be subjective, as there is no universally agreed-upon definition of how small the body must be.
- Lack of Directional Bias: The double doji primarily indicates indecision, not a specific direction. Confirmation is crucial to determine the potential direction of the price movement.
- Market Context: The effectiveness of the double doji pattern can vary depending on the overall market conditions and the specific asset being traded.
Risk Management Considerations
As with any trading strategy, proper risk management is crucial when trading the double doji pattern. Always use stop-loss orders to limit potential losses, and never risk more than you can afford to lose. Consider adjusting your position size based on the volatility of the market and the strength of the signal. Diversification is also a key element of risk management. [See also: Essential Risk Management Techniques for Traders]
Examples of Double Doji in Action
Let’s examine a couple of hypothetical examples to illustrate how the double doji pattern can be used in real-world trading scenarios:
Example 1: Bullish Reversal
Imagine a stock has been in a sustained downtrend. A double doji pattern forms at a support level. This suggests that the selling pressure is waning and a potential reversal is brewing. A trader might wait for a bullish candlestick pattern (e.g., a bullish engulfing pattern) to confirm the reversal before entering a long position. The stop-loss would be placed below the low of the double doji formation.
Example 2: Bearish Reversal
Consider a cryptocurrency that has been in a strong uptrend. A double doji pattern forms at a resistance level. This suggests that the buying pressure is exhausted and a potential reversal is likely. A trader might wait for a bearish candlestick pattern (e.g., a bearish engulfing pattern) to confirm the reversal before entering a short position. The stop-loss would be placed above the high of the double doji formation.
Conclusion: Mastering the Double Doji
The double doji pattern is a valuable tool for traders seeking to identify potential trend reversals and periods of indecision in the market. By understanding its formation, interpretation, and limitations, traders can incorporate this pattern into their trading strategies to make more informed decisions. However, it’s crucial to remember that the double doji should not be used in isolation. Always seek confirmation from other indicators and price action, and prioritize proper risk management to protect your capital. With practice and experience, you can master the art of decoding the double doji and use it to your advantage in the financial markets. The double doji, when correctly identified, can be a powerful addition to any technical trader’s toolbox. Don’t underestimate the power of the double doji, especially when it aligns with other confirming indicators. Remember to always practice sound risk management when trading any pattern, including the double doji.
The appearance of the double doji often leads to increased volatility, so prepare accordingly. The double doji can appear in any market, from stocks to forex to cryptocurrencies. The double doji is a sign of market indecision, and should be treated as such. Understanding the double doji can give you an edge in the market. The double doji is a powerful pattern when combined with other technical indicators. Look for the double doji on your charts and see if it can help improve your trading. The double doji is just one of many candlestick patterns, so continue to learn and expand your knowledge. The double doji is a valuable tool for identifying potential trend reversals.
