Decoding the Double Doji: A Comprehensive Guide to Understanding This Powerful Candlestick Pattern
In the dynamic world of financial markets, traders and investors constantly seek reliable tools and patterns to predict future price movements. Among the most intriguing and potentially lucrative is the double doji. This candlestick pattern, characterized by two consecutive doji formations, signals a high degree of indecision in the market and often precedes significant trend reversals. Understanding the nuances of the double doji pattern is crucial for making informed trading decisions and mitigating risk. This comprehensive guide delves into the intricacies of the double doji, exploring its formation, interpretation, and practical application in various trading scenarios.
What is a Doji?
Before we dive into the specifics of the double doji, it’s essential to understand the single doji candlestick pattern. A doji forms when the opening and closing prices of an asset are virtually equal, resulting in a small or nonexistent body. The length of the upper and lower shadows, however, can vary. This pattern indicates a state of equilibrium between buyers and sellers, suggesting that neither side was able to gain significant control during the trading period. The presence of a doji signifies indecision and potential trend change.
Types of Doji Candlesticks
- Long-Legged Doji: Characterized by long upper and lower shadows, indicating significant price fluctuation during the session.
- Gravestone Doji: Forms when the opening and closing prices are at the low end of the trading range, with a long upper shadow. This is often a bearish reversal signal.
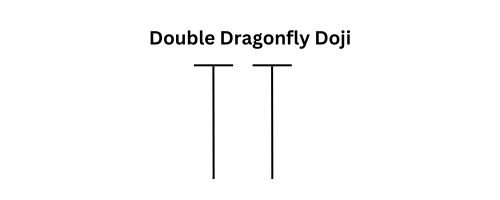
- Dragonfly Doji: Forms when the opening and closing prices are at the high end of the trading range, with a long lower shadow. This is often a bullish reversal signal.
- Four-Price Doji: A rare doji with no shadows, indicating that the open, high, low, and close prices were all the same.
The Double Doji Pattern Explained
The double doji pattern occurs when two doji candlesticks form consecutively. This amplified indecision can signal a more powerful potential reversal than a single doji. The market is essentially pausing, re-evaluating, and preparing for a potential shift in direction. It is important to note that the double doji is not a standalone signal and should be confirmed with other technical indicators and analysis.
Formation of a Double Doji
The formation of a double doji pattern requires two consecutive trading sessions where the opening and closing prices are nearly identical. The shadows (highs and lows) may vary, but the key is the small or absent bodies of both candlesticks. This pattern often appears after a prolonged uptrend or downtrend, suggesting that the prevailing trend is losing momentum.
Interpreting the Double Doji
Interpreting a double doji requires careful consideration of the preceding trend and the surrounding market context. Here’s a breakdown of how to interpret this pattern:
- After an Uptrend: A double doji appearing after an uptrend can signal a potential bearish reversal. The indecision suggests that buyers are losing steam, and sellers may be preparing to take control. Look for confirmation signals, such as a bearish candlestick pattern on the following day or a break below a key support level.
- After a Downtrend: Conversely, a double doji appearing after a downtrend can signal a potential bullish reversal. The indecision suggests that sellers are losing momentum, and buyers may be preparing to step in. Look for confirmation signals, such as a bullish candlestick pattern on the following day or a break above a key resistance level.
- Confirmation is Key: Always seek confirmation before acting on a double doji signal. Confirmation can come from other technical indicators, such as the Relative Strength Index (RSI), Moving Average Convergence Divergence (MACD), or volume analysis. [See also: RSI Trading Strategies]
Trading Strategies Using the Double Doji Pattern
Several trading strategies can be employed when a double doji pattern is identified. Here are a few examples:
Breakout Strategy
One common strategy is to wait for a breakout above the high or below the low of the double doji pattern. If the price breaks above the high, it could signal a bullish continuation or reversal, depending on the preceding trend. Conversely, if the price breaks below the low, it could signal a bearish continuation or reversal. Place a stop-loss order just below the low (for a long position) or just above the high (for a short position) to manage risk.
Confirmation with Oscillators
Combine the double doji pattern with oscillators like the RSI or MACD to improve the accuracy of your trading signals. For example, if a double doji appears after an uptrend and the RSI is overbought, it strengthens the bearish reversal signal. Conversely, if a double doji appears after a downtrend and the RSI is oversold, it strengthens the bullish reversal signal. [See also: MACD for Beginners]
Volume Analysis
Pay attention to the volume during and after the formation of the double doji. Increased volume on the breakout can confirm the validity of the signal. For example, if the price breaks above the high of the double doji with high volume, it suggests strong buying pressure and increases the likelihood of a sustained uptrend.
Limitations of the Double Doji Pattern
While the double doji can be a valuable tool, it’s important to acknowledge its limitations:
- False Signals: Like all technical indicators, the double doji can produce false signals. It’s crucial to use confirmation techniques and consider the broader market context.
- Subjectivity: Identifying a double doji can be subjective, as the definition of a doji (equal opening and closing prices) may vary slightly.
- Time Frame Dependency: The effectiveness of the double doji can vary depending on the time frame. It may be more reliable on longer time frames (e.g., daily or weekly charts) than on shorter time frames (e.g., hourly charts).
Real-World Examples of the Double Doji
To better understand the application of the double doji, let’s consider a few hypothetical examples:
Example 1: Imagine a stock has been in a strong uptrend for several weeks. A double doji forms near a key resistance level. This suggests that the uptrend may be losing momentum, and a bearish reversal is possible. Traders might look for confirmation, such as a bearish engulfing pattern or a break below a short-term moving average, before initiating a short position.
Example 2: Consider a currency pair that has been in a downtrend for several days. A double doji forms near a key support level. This suggests that the downtrend may be exhausting itself, and a bullish reversal is possible. Traders might look for confirmation, such as a bullish harami pattern or a break above a short-term moving average, before initiating a long position.
Risk Management
Effective risk management is paramount when trading any pattern, including the double doji. Always use stop-loss orders to limit potential losses. Determine your risk tolerance before entering a trade and never risk more than you can afford to lose. Consider using position sizing techniques to adjust your trade size based on the volatility of the asset and your risk tolerance.
Conclusion
The double doji pattern is a valuable tool for traders and investors seeking to identify potential trend reversals. By understanding the formation, interpretation, and limitations of this pattern, traders can improve their decision-making and enhance their trading strategies. Remember to always seek confirmation, manage risk effectively, and consider the broader market context when using the double doji to make trading decisions. The double doji, when used in conjunction with other technical analysis techniques, can be a powerful addition to any trader’s arsenal. Recognizing the double doji is just the first step; mastering its application requires practice, patience, and a disciplined approach. The ability to identify a potential double doji and act accordingly can significantly improve trading outcomes, but it’s crucial to remember that no pattern guarantees success. Continuous learning and adaptation are essential for navigating the complexities of the financial markets. Utilizing the double doji effectively involves understanding market sentiment, volume analysis, and confirmation from other indicators. The double doji is not a magic bullet, but a valuable piece of the puzzle in the quest for successful trading. [See also: Advanced Candlestick Patterns]
