Decoding the Double Doji: A Comprehensive Guide to Understanding This Powerful Candlestick Pattern
In the dynamic world of financial trading, candlestick patterns serve as crucial indicators of potential market movements. Among these patterns, the double doji stands out as a significant signal, often hinting at indecision or a potential reversal in the prevailing trend. This article delves into the intricacies of the double doji, exploring its formation, interpretation, and application in trading strategies. Understanding the nuances of a double doji can empower traders to make more informed decisions and navigate market uncertainties with greater confidence.
What is a Doji Candlestick?
Before diving into the specifics of the double doji, it’s essential to understand the fundamental building block: the doji candlestick. A doji forms when the opening and closing prices of a security are virtually equal within a given trading period. This results in a small or nonexistent body, with long upper and lower shadows (wicks) indicating price fluctuation during the period. The doji represents a state of equilibrium between buyers and sellers, suggesting indecision in the market.
There are several variations of the doji, including the long-legged doji, dragonfly doji, and gravestone doji, each with its own subtle implications. However, the core characteristic remains the same: a close near the open, signifying a tug-of-war between bullish and bearish forces.
The Double Doji Pattern Explained
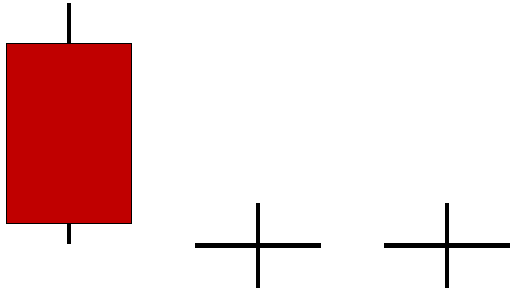
A double doji pattern occurs when two doji candlesticks appear consecutively on a price chart. This amplifies the signal of indecision conveyed by a single doji. The double doji suggests that the market is experiencing a prolonged period of uncertainty, with neither buyers nor sellers able to establish dominance. This can often precede a significant price movement, making it a pattern worth watching closely.
The appearance of a double doji doesn’t automatically guarantee a reversal or continuation of the existing trend. Instead, it serves as a warning sign, prompting traders to exercise caution and seek confirmation from other technical indicators before making any trading decisions. The context in which the double doji appears is crucial in determining its potential impact.
Interpreting the Double Doji: Context is Key
The interpretation of a double doji pattern heavily relies on the surrounding market context. Here are some factors to consider:
Prior Trend
The prevailing trend before the formation of the double doji is a critical factor. If the double doji appears after a sustained uptrend, it may signal a potential trend reversal, suggesting that the bullish momentum is waning. Conversely, if it occurs after a downtrend, it could indicate that the bearish pressure is weakening, potentially leading to a bullish reversal.
Volume
Volume analysis can provide additional insights into the significance of the double doji. If the double doji forms with high trading volume, it suggests that the indecision is widespread and the potential for a significant price movement is higher. Conversely, low volume during the formation of the double doji may indicate a lack of conviction and a lower probability of a strong price reaction.
Support and Resistance Levels
The location of the double doji relative to key support and resistance levels is also important. If the double doji forms near a significant resistance level after an uptrend, it strengthens the possibility of a bearish reversal. Similarly, if it appears near a support level after a downtrend, it increases the likelihood of a bullish reversal. [See also: Support and Resistance Trading Strategies]
Confirmation Signals
It’s crucial to seek confirmation from other technical indicators before acting on a double doji pattern. This can include:
- Candlestick Confirmation: Waiting for a bearish candlestick to close below the low of the double doji after an uptrend, or a bullish candlestick to close above the high of the double doji after a downtrend.
- Moving Averages: Observing whether the price crosses below or above key moving averages after the double doji formation.
- Oscillators: Using oscillators like the Relative Strength Index (RSI) or Moving Average Convergence Divergence (MACD) to confirm overbought or oversold conditions.
Trading Strategies Using the Double Doji
Here are a few potential trading strategies that incorporate the double doji pattern:
Reversal Strategy
This strategy involves identifying double doji patterns that form at the end of a trend and using them as potential reversal signals. For example, if a double doji appears after a prolonged uptrend and is confirmed by a bearish candlestick, a trader might consider entering a short position. Conversely, if a double doji forms after a downtrend and is confirmed by a bullish candlestick, a trader might consider entering a long position. Stop-loss orders should be placed strategically to limit potential losses.
Breakout Strategy
This strategy focuses on identifying double doji patterns that form within a consolidation range. A trader would wait for the price to break out above the high or below the low of the double doji pattern before entering a trade. A breakout above the high would signal a potential bullish move, while a breakout below the low would indicate a potential bearish move. [See also: Identifying Breakout Patterns]
Range Trading Strategy
When a double doji forms within a defined trading range, traders can use it as a signal to trade within the range. They can buy near the support level and sell near the resistance level, with the double doji acting as a confirmation of the range’s integrity. This strategy is best suited for markets that are exhibiting sideways movement.
Limitations of the Double Doji
While the double doji can be a valuable tool, it’s essential to acknowledge its limitations:
- False Signals: The double doji, like any technical indicator, can produce false signals. It’s crucial to use confirmation techniques to filter out unreliable signals.
- Subjectivity: The interpretation of the double doji can be subjective, as traders may have different perspectives on what constitutes a valid pattern.
- Market Volatility: In highly volatile markets, the double doji may be less reliable due to erratic price movements.
Real-World Examples of the Double Doji
Let’s consider a hypothetical example. Suppose a stock has been trending upwards for several weeks. Suddenly, two consecutive doji candlesticks appear near a key resistance level. This double doji pattern suggests that the bullish momentum is weakening and the stock may be poised for a reversal. A trader might then look for confirmation signals, such as a bearish candlestick or a breakdown below a moving average, before entering a short position.
Another example could involve a cryptocurrency that has been declining steadily. If a double doji forms near a support level, it could indicate that the bearish pressure is subsiding and the cryptocurrency may be ready for a bounce. A trader might then seek confirmation signals, such as a bullish candlestick or a breakout above a moving average, before entering a long position.
Advanced Tips for Trading the Double Doji
To enhance your trading performance with the double doji, consider these advanced tips:
- Combine with Fibonacci Levels: Look for double doji patterns that form near Fibonacci retracement levels, as these areas often act as significant support or resistance.
- Use Multiple Timeframes: Analyze the double doji pattern across multiple timeframes to gain a more comprehensive understanding of the market’s sentiment.
- Backtest Your Strategies: Before implementing any double doji trading strategy, backtest it on historical data to assess its effectiveness and profitability.
The Psychology Behind the Double Doji
The double doji pattern reflects a state of psychological equilibrium in the market. It represents a period where buyers and sellers are equally matched, leading to indecision and uncertainty. Understanding the psychology behind the double doji can help traders anticipate potential market movements and make more informed decisions. The pattern highlights a moment of pause, where the previous trend’s momentum is challenged, and the market seeks a new direction. Identifying this psychological shift is key to effectively utilizing the double doji in trading.
Conclusion
The double doji is a powerful candlestick pattern that can provide valuable insights into market sentiment and potential price movements. By understanding its formation, interpretation, and limitations, traders can incorporate the double doji into their trading strategies to improve their decision-making and potentially enhance their profitability. However, it’s crucial to remember that the double doji should not be used in isolation. Always seek confirmation from other technical indicators and consider the overall market context before making any trading decisions. With careful analysis and a disciplined approach, the double doji can become a valuable asset in your trading toolkit. The appearance of a double doji can be a key indicator, but prudent trading always calls for corroborating evidence. Understanding the double doji is just one piece of the puzzle in successful trading.
