
Decoding the Double Doji: A Comprehensive Guide to Understanding This Powerful Candlestick Pattern
In the intricate world of financial markets, candlestick patterns serve as visual representations of price movements, offering valuable insights to traders and investors. Among these patterns, the double doji stands out as a particularly significant signal, often indicating indecision or a potential reversal in the prevailing trend. Understanding the nuances of the double doji, its formation, and its implications can significantly enhance your trading strategy. This comprehensive guide delves into the intricacies of the double doji, providing a clear and concise explanation of its characteristics and how to interpret its signals effectively.
What is a Doji? A Foundation for Understanding the Double Doji
Before exploring the double doji, it’s crucial to understand the fundamental concept of a single doji candlestick. A doji forms when the opening and closing prices of an asset are virtually equal during a specific trading period. This results in a candlestick with a small or non-existent body, often resembling a cross, plus sign, or gravestone. The length of the upper and lower shadows (the lines extending above and below the body) can vary, reflecting the price fluctuations during that period.
The doji signifies a state of equilibrium between buyers and sellers. Neither side managed to gain a significant advantage, leading to a stalemate in price movement. This indecision can be a powerful signal, suggesting a potential shift in market sentiment.
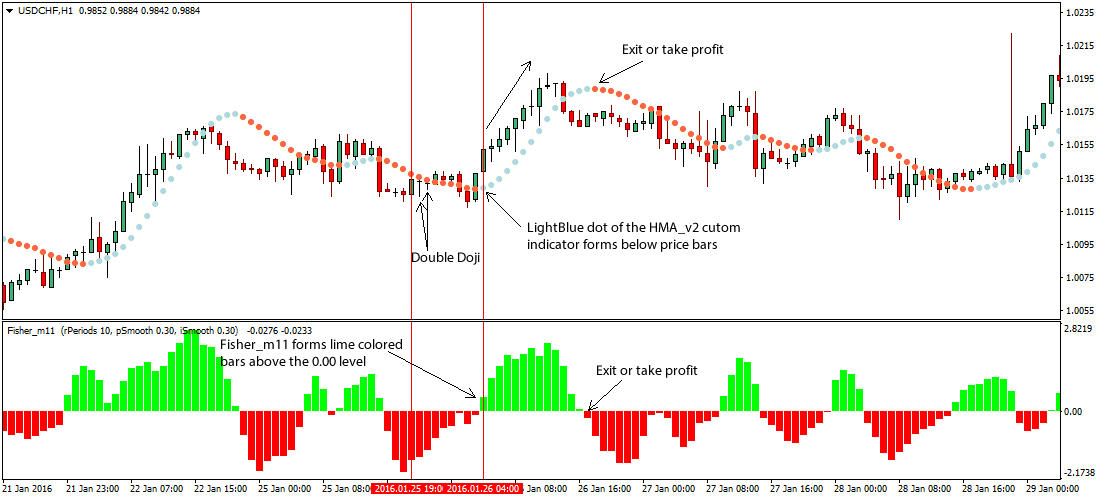
The Double Doji: Two Dojis in a Row
The double doji pattern occurs when two doji candlesticks form consecutively on a price chart. This amplifies the signal of indecision and potential trend reversal. The appearance of a double doji suggests that the market is in a state of heightened uncertainty, with neither buyers nor sellers able to establish dominance over two consecutive trading periods. This prolonged indecision can often precede a significant price movement in either direction.
It’s important to note that the interpretation of a double doji pattern depends heavily on the context in which it appears. Analyzing the preceding trend, volume, and other technical indicators is crucial for accurately assessing the potential implications of this pattern.
Types of Doji Candlesticks and Their Significance
While the basic definition of a doji remains consistent, there are variations in the shape and characteristics of doji candlesticks, each carrying slightly different implications:
- Long-Legged Doji: This doji has long upper and lower shadows, indicating significant price fluctuation during the trading period. It suggests a high degree of volatility and uncertainty.
- Gravestone Doji: The gravestone doji has a long upper shadow and little or no lower shadow. It typically appears at the top of an uptrend and can signal a potential bearish reversal. [See also: Understanding Bearish Reversal Patterns]
- Dragonfly Doji: The dragonfly doji has a long lower shadow and little or no upper shadow. It often appears at the bottom of a downtrend and can indicate a potential bullish reversal. [See also: Identifying Bullish Reversal Indicators]
- Four-Price Doji: This is a rare doji where the open, high, low, and close prices are all the same. It represents complete indecision and is often found in low-volume trading environments.
Understanding these different types of doji candlesticks can provide further insight into the market sentiment and the potential direction of future price movements. Recognizing a double doji pattern formed by specific doji variations can strengthen the signal and improve the accuracy of your trading decisions.
Interpreting the Double Doji: Context is Key
As mentioned earlier, the interpretation of a double doji pattern is highly dependent on the context in which it appears. Here are some key factors to consider:
- Preceding Trend: Is the double doji forming after a prolonged uptrend or downtrend? A double doji at the end of an uptrend could signal a potential bearish reversal, while a double doji at the end of a downtrend could indicate a potential bullish reversal.
- Volume: High volume during the formation of the double doji can add weight to the signal, suggesting a strong conviction among traders. Low volume may indicate a lack of interest and a less reliable signal.
- Confirmation: It’s always prudent to seek confirmation of the double doji signal from other technical indicators or price action. For example, a break below the low of the double doji after an uptrend could confirm a bearish reversal.
- Support and Resistance Levels: The location of the double doji relative to key support and resistance levels can also provide valuable clues. A double doji forming near a strong resistance level after an uptrend could strengthen the bearish reversal signal.
Trading Strategies Using the Double Doji
The double doji pattern can be incorporated into various trading strategies. Here are a few examples:
- Reversal Trading: Identify double doji patterns at the end of established trends and look for confirmation signals before entering a trade in the opposite direction.
- Breakout Trading: Wait for a breakout above or below the high or low of the double doji to confirm the direction of the price movement.
- Range Trading: If the double doji forms within a defined trading range, use it as a signal to trade within the range, buying near support and selling near resistance.
Remember to always use appropriate risk management techniques, such as setting stop-loss orders, to protect your capital.
Limitations of the Double Doji
While the double doji can be a valuable tool, it’s important to acknowledge its limitations:
- False Signals: Like all technical indicators, the double doji can generate false signals. It’s crucial to use confirmation signals and consider the overall market context.
- Subjectivity: The interpretation of candlestick patterns can be subjective, and different traders may perceive the same pattern differently.
- Not a Standalone Indicator: The double doji should not be used as a standalone indicator. It’s best used in conjunction with other technical analysis tools and fundamental analysis.
Examples of Double Doji in Real-World Scenarios
Let’s look at a few hypothetical examples of how the double doji might appear in real-world trading scenarios:
Example 1: Bearish Reversal
Imagine a stock has been trending upwards for several weeks. Suddenly, a double doji pattern appears near a well-established resistance level. The volume during the formation of the double doji is high. This could be a strong indication of a potential bearish reversal. A trader might wait for a break below the low of the double doji or confirmation from other indicators, such as a bearish divergence in the Relative Strength Index (RSI), before entering a short position.
Example 2: Bullish Reversal
Consider a cryptocurrency that has been experiencing a significant downtrend. A double doji pattern forms near a strong support level. The second doji is a dragonfly doji, further strengthening the bullish signal. This could suggest a potential bullish reversal. A trader might wait for a break above the high of the double doji or confirmation from other indicators, such as a bullish engulfing pattern, before entering a long position.
Conclusion: Mastering the Double Doji for Enhanced Trading
The double doji is a powerful candlestick pattern that can provide valuable insights into market sentiment and potential trend reversals. By understanding its formation, characteristics, and limitations, traders can effectively incorporate it into their trading strategies. Remember to always consider the context in which the double doji appears, seek confirmation from other indicators, and use appropriate risk management techniques. Mastering the art of interpreting the double doji can significantly enhance your ability to make informed trading decisions and improve your overall trading performance. Recognizing the double doji is a crucial step, and with diligent practice and analysis, you can unlock its potential and leverage it for more profitable trading outcomes. The double doji is a key component in understanding market indecision. Therefore, understanding the double doji will give you an edge.
