
Decoding the Hammer Candle in Stock Trading: A Comprehensive Guide
In the dynamic world of stock trading, understanding various candlestick patterns is crucial for making informed decisions. Among these patterns, the hammer candle stands out as a significant indicator of potential trend reversals. This article delves into the intricacies of the hammer candle in stock trading, providing a comprehensive guide to help traders identify, interpret, and utilize this powerful pattern effectively.
What is a Hammer Candle?
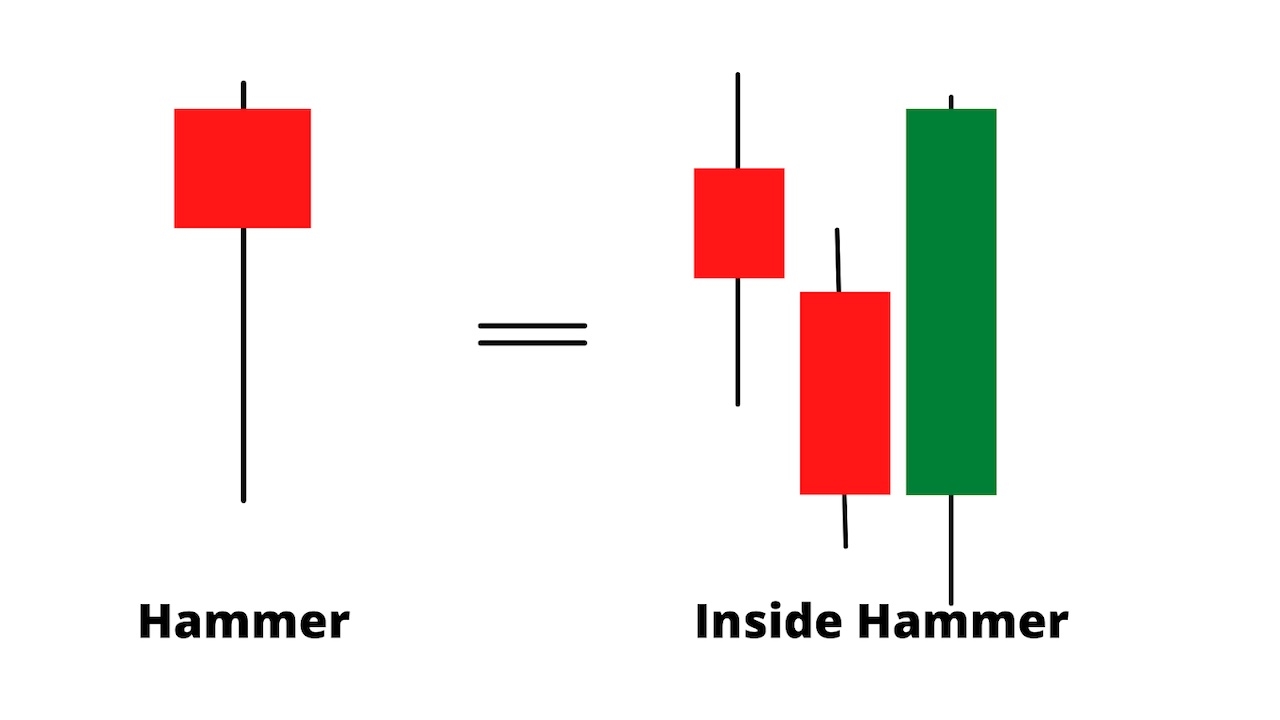
The hammer candle is a single candlestick pattern that appears on a price chart. It is characterized by a small body, a long lower shadow (or wick), and a little or no upper shadow. The body represents the difference between the opening and closing prices, while the long lower shadow indicates that the price initially declined significantly during the trading period but recovered to close near the opening price. This suggests a potential bullish reversal, especially when the hammer candle appears after a downtrend.
Key Characteristics of a Hammer Candle:
- Small Body: The real body (the difference between open and close) should be small relative to the rest of the candle.
- Long Lower Shadow: The lower shadow should be at least twice the length of the body.
- Little or No Upper Shadow: Ideally, there should be no upper shadow, but a very small one is acceptable.
- Appears After a Downtrend: The hammer candle is most significant when it forms after a series of declining prices.
How to Identify a Hammer Candle
Identifying a hammer candle requires careful observation of price charts. Look for candles that meet the characteristics mentioned above, particularly after a period of bearish activity. The color of the body (whether it’s bullish or bearish) is less important than the shape of the candle itself. However, a bullish hammer candle (where the closing price is higher than the opening price) can provide a stronger signal.
Steps to Identify a Hammer Candle:
- Identify a Downtrend: Ensure that the stock is in a downtrend before looking for a hammer candle.
- Look for the Shape: Find a candle with a small body and a long lower shadow, with little to no upper shadow.
- Confirm the Reversal: Wait for confirmation in the subsequent trading periods to ensure that the price is indeed reversing upwards.
Interpreting the Hammer Candle
The hammer candle signifies a potential shift in market sentiment. The long lower shadow indicates that sellers initially drove the price down, but buyers stepped in and pushed the price back up, suggesting that the bearish momentum is weakening. This can be interpreted as a sign that the stock is becoming oversold and that buyers are starting to gain control.
Understanding the Psychology Behind the Hammer:
The hammer candle represents a battle between buyers and sellers. The long lower shadow reflects the sellers’ attempt to push the price lower, while the small body indicates that the buyers managed to resist and bring the price back up. This suggests a loss of conviction among sellers and a potential increase in buying pressure. The hammer candle is therefore a signal of potential bullish reversal.
Trading Strategies Using the Hammer Candle
While the hammer candle can be a valuable tool for identifying potential reversals, it’s important to use it in conjunction with other technical indicators and analysis techniques. Here are some trading strategies that incorporate the hammer candle:
Confirmation is Key:
Always wait for confirmation before entering a trade based on a hammer candle. This can be a bullish candle that closes above the high of the hammer candle, or a break above a nearby resistance level. Confirmation helps to reduce the risk of false signals.
Using Stop-Loss Orders:
Place a stop-loss order below the low of the hammer candle to limit potential losses if the price continues to decline. This helps to protect your capital and manage risk effectively.
Combining with Other Indicators:
Use other technical indicators, such as the Relative Strength Index (RSI), Moving Averages, or Fibonacci retracement levels, to confirm the reversal signal provided by the hammer candle. For example, if the RSI is oversold and a hammer candle appears, it could provide a stronger signal of a potential reversal.
Example Trading Scenario:
Imagine a stock has been in a downtrend for several weeks. Suddenly, a hammer candle appears on the daily chart. The lower shadow of the hammer candle is long, indicating strong buying pressure. To confirm the reversal, you wait for the next day’s candle to close above the high of the hammer candle. Once confirmed, you enter a long position with a stop-loss order placed below the low of the hammer candle. [See also: Understanding Candlestick Patterns] Your target price could be a previous resistance level or a Fibonacci retracement level.
Variations of the Hammer Candle
There are a few variations of the hammer candle that traders should be aware of:
The Inverted Hammer:
The inverted hammer candle is the opposite of the hammer candle. It has a small body, a long upper shadow, and little or no lower shadow. It appears after a downtrend and suggests a potential bullish reversal. The inverted hammer candle indicates that buyers initially pushed the price higher, but sellers managed to bring it back down. However, the fact that buyers were able to push the price up at all suggests that the bearish momentum is weakening.
The Hanging Man:
The hanging man is identical in shape to the hammer candle but appears after an uptrend. It is considered a bearish reversal pattern, suggesting that the bullish momentum is weakening and that a downtrend may be imminent. The hanging man indicates that sellers are starting to gain control of the market.
Limitations of the Hammer Candle
While the hammer candle can be a valuable tool, it’s important to be aware of its limitations:
False Signals:
The hammer candle can sometimes generate false signals, especially in volatile markets. It’s important to wait for confirmation and use other technical indicators to validate the reversal signal.
Subjectivity:
Identifying and interpreting hammer candle patterns can be subjective. Different traders may have different interpretations of the same pattern. It’s important to develop a consistent approach and to backtest your strategies to ensure their effectiveness.
Context is Crucial:
The significance of a hammer candle depends on the context in which it appears. It’s important to consider the overall trend, the market conditions, and other technical factors before making a trading decision based on a hammer candle.
Real-World Examples of Hammer Candle in Stock Trading
To illustrate the practical application of the hammer candle, let’s examine a few real-world examples of its occurrence in stock charts. These examples will showcase how the hammer candle can signal potential trend reversals and provide valuable insights for traders.
Example 1: Apple Inc. (AAPL)
Consider a scenario where Apple Inc. (AAPL) has been experiencing a period of decline in its stock price. After several weeks of bearish momentum, a distinct hammer candle appears on the daily chart. This hammer candle is characterized by a small body, a long lower shadow extending well below the body, and minimal upper shadow. The appearance of this pattern suggests that buyers have stepped in to counter the selling pressure, potentially signaling a reversal of the downtrend. Traders who recognize this hammer candle might consider initiating a long position, anticipating a bullish move in AAPL’s stock price.
Example 2: Tesla Inc. (TSLA)
Another example involves Tesla Inc. (TSLA). Imagine TSLA’s stock price has been trending downwards, facing persistent selling pressure. Suddenly, a hammer candle forms on the chart, indicating a possible shift in market sentiment. The long lower shadow of the hammer candle suggests that despite initial attempts to push the price lower, buyers have intervened, driving the price back up towards the opening level. This hammer candle could be interpreted as a sign that the bearish momentum is waning, and a bullish reversal may be on the horizon. Traders observing this pattern might consider entering a long position, expecting TSLA’s stock price to rebound.
Conclusion
The hammer candle is a powerful tool for identifying potential trend reversals in stock trading. By understanding its characteristics, interpreting its signals, and using it in conjunction with other technical indicators, traders can improve their decision-making and increase their chances of success. However, it’s important to remember that the hammer candle is not a foolproof indicator and should be used with caution. Always wait for confirmation, manage risk effectively, and consider the overall market context before making any trading decisions. The hammer candle, when used wisely, can be a valuable addition to any trader’s toolkit.
