Decoding the Hammer Pattern: A Comprehensive Guide for Stock Market Traders
In the dynamic world of stock trading, identifying potential trend reversals is crucial for maximizing profits and minimizing losses. One such indicator that traders often rely on is the hammer pattern. This candlestick pattern, characterized by its distinctive shape, can signal a potential bullish reversal after a downtrend. This article provides a comprehensive guide to understanding the hammer pattern, its significance, how to identify it, and how to use it effectively in your trading strategy. We’ll delve into the nuances of the hammer pattern, ensuring you can confidently interpret its signals and make informed trading decisions. Understanding the hammer pattern is a valuable tool for any stock market participant.
What is the Hammer Pattern?
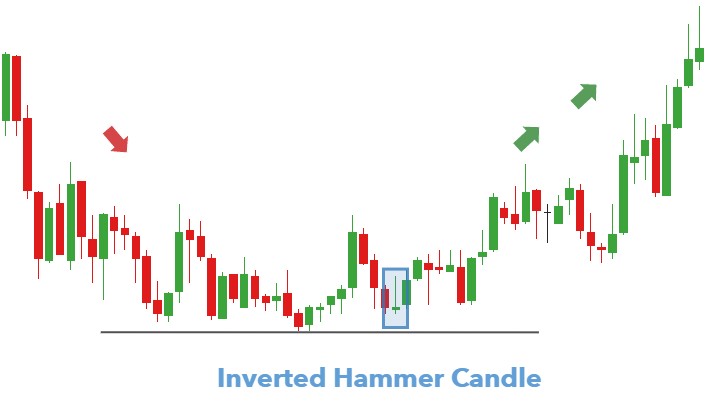
The hammer pattern is a single candlestick pattern that appears after a downtrend. It suggests that the market may have found a bottom and that prices could start to rise. The candlestick has a small body located at the upper end of the trading range, a long lower shadow (or wick) that is at least twice the length of the body, and little or no upper shadow. The color of the body (whether it’s bullish/white or bearish/black) is not as important as the shape, but a bullish hammer is generally considered a stronger signal.
Essentially, the long lower shadow indicates that sellers initially pushed the price down significantly during the trading period. However, buyers then stepped in and drove the price back up to close near the opening price. This suggests a shift in sentiment from bearish to bullish, indicating that the downtrend might be losing momentum.
Characteristics of a Hammer Candlestick
- Small Body: The real body (the difference between the open and close price) is small.
- Long Lower Shadow: The lower shadow is at least twice the length of the real body. This is the defining characteristic of a hammer pattern.
- Little or No Upper Shadow: Ideally, there should be very little or no upper shadow. A significant upper shadow weakens the signal.
- Preceding Downtrend: The hammer pattern must appear after a noticeable downtrend to be considered valid.
Identifying a Valid Hammer Pattern
To correctly identify a hammer pattern, consider the following:
- Confirm a Downtrend: Ensure that the candlestick appears after a clear downtrend. A hammer pattern appearing in isolation is not a reliable signal.
- Shadow Length: Verify that the lower shadow is at least twice the length of the real body.
- Body Size: The real body should be relatively small compared to the shadow.
- Upper Shadow: The shorter the upper shadow, the better. Ideally, there should be none.
- Confirmation: Wait for confirmation from subsequent candlesticks. A bullish confirmation would be a candlestick that closes above the high of the hammer pattern.
The Psychology Behind the Hammer Pattern
Understanding the psychology behind the hammer pattern can provide deeper insights into its potential effectiveness. During a downtrend, sellers are in control, pushing prices lower. The long lower shadow of the hammer pattern signifies a significant push lower by sellers, potentially triggering stop-loss orders and panic selling. However, the subsequent rally back towards the opening price indicates strong buying pressure. This suggests that buyers have absorbed the selling pressure and are now gaining control. This shift in sentiment is what makes the hammer pattern a potential bullish reversal signal.
Trading Strategies Using the Hammer Pattern
The hammer pattern can be used as part of a broader trading strategy. Here are a few approaches:
Entry Points
Traders typically look to enter a long position after the hammer pattern is confirmed. Confirmation usually comes in the form of the next candlestick closing above the high of the hammer pattern. Some traders might also wait for a further pullback to the 50% retracement level of the hammer pattern before entering.
Stop-Loss Placement
A common stop-loss placement strategy is to set the stop-loss order just below the low of the hammer pattern. This helps to limit potential losses if the reversal fails and the downtrend continues.
Profit Targets
Profit targets can be determined using various methods, such as Fibonacci extensions, resistance levels, or risk-reward ratios. A common approach is to aim for a profit target that is at least two or three times the risk (the distance between the entry point and the stop-loss level).
Hammer Pattern vs. Hanging Man Pattern
It’s important to differentiate the hammer pattern from the hanging man pattern. While they look similar, their implications are different. The hanging man pattern appears after an uptrend and suggests a potential bearish reversal. The hammer pattern, as we’ve discussed, appears after a downtrend and signals a potential bullish reversal. The key difference lies in the preceding trend.
Limitations of the Hammer Pattern
Like any technical indicator, the hammer pattern is not foolproof. It’s essential to be aware of its limitations:
- False Signals: The hammer pattern can sometimes generate false signals. The market may not always reverse after a hammer pattern appears.
- Confirmation Required: Always wait for confirmation from subsequent candlesticks before entering a trade.
- Context is Key: Consider the broader market context and other technical indicators before making a trading decision.
- Volume Analysis: Analyzing the volume during the formation of the hammer pattern can provide additional insights. Higher volume during the rally back to the opening price can strengthen the signal.
Examples of Hammer Patterns in Real-World Scenarios
Let’s look at a hypothetical example. Imagine a stock has been in a steady downtrend for several weeks. One day, a candlestick forms with a small body, a long lower shadow, and little to no upper shadow – a clear hammer pattern. The next day, the stock opens higher and closes above the high of the hammer candlestick. This confirms the hammer pattern, and a trader might enter a long position, placing a stop-loss order just below the low of the hammer pattern.
Another example could be found by analyzing historical stock charts. Review charts of companies you follow and identify instances where the hammer pattern appeared. Analyze the subsequent price action to see how the market reacted. This practical exercise can help you develop a better understanding of the hammer pattern and its potential effectiveness.
Combining Hammer Pattern with Other Technical Indicators
To increase the reliability of the hammer pattern, it’s recommended to combine it with other technical indicators, such as:
- Moving Averages: Look for hammer patterns that form near a key moving average support level.
- Relative Strength Index (RSI): Check if the RSI is oversold when the hammer pattern forms. An oversold RSI can further strengthen the bullish reversal signal.
- Fibonacci Retracement Levels: Identify hammer patterns that appear near Fibonacci retracement levels. These levels can act as potential support areas.
Advanced Hammer Pattern Strategies
Experienced traders might explore more advanced strategies involving the hammer pattern:
- Multiple Timeframe Analysis: Analyze the hammer pattern across different timeframes. A hammer pattern appearing on a daily chart, confirmed by a similar pattern on a weekly chart, can be a stronger signal.
- Hammer Pattern with Volume Confirmation: Pay close attention to the volume during the formation of the hammer pattern. A significant increase in volume during the rally back to the opening price can indicate strong buying pressure.
- Combining Hammer Pattern with Options Strategies: Use the hammer pattern to inform options trading strategies, such as buying call options or selling put options.
Conclusion
The hammer pattern is a valuable tool for stock market traders looking to identify potential bullish reversals after a downtrend. By understanding its characteristics, psychology, and limitations, traders can effectively incorporate the hammer pattern into their trading strategies. Remember to always wait for confirmation, consider the broader market context, and use other technical indicators to increase the reliability of the signal. Mastering the interpretation of the hammer pattern can significantly enhance your trading skills and improve your overall profitability. Always practice responsible risk management and continue to learn and adapt your strategies to the ever-changing market conditions. The hammer pattern, when used correctly, is a powerful addition to any trader’s toolkit. [See also: Understanding Candlestick Patterns] and [See also: Technical Analysis for Beginners]
