Decoding the Hammer Pattern: A Comprehensive Guide for Stock Traders
The stock market is a complex arena where fortunes can be made and lost in the blink of an eye. To navigate this intricate landscape, traders and investors rely on various tools and techniques, one of which is the art of candlestick charting. Among the numerous candlestick patterns, the hammer pattern stands out as a crucial signal for potential bullish reversals. This comprehensive guide aims to dissect the hammer pattern, providing a clear understanding of its formation, interpretation, and application in stock trading.
Understanding Candlestick Patterns
Before diving into the specifics of the hammer pattern, it’s essential to grasp the basics of candlestick charts. Candlesticks visually represent price movements over a specific period, typically a day. Each candlestick consists of a body and wicks (or shadows). The body represents the range between the opening and closing prices, while the wicks indicate the highest and lowest prices reached during that period. Color-coding further enhances the visual representation, with green or white usually signifying a price increase and red or black indicating a price decrease.
What is the Hammer Pattern?
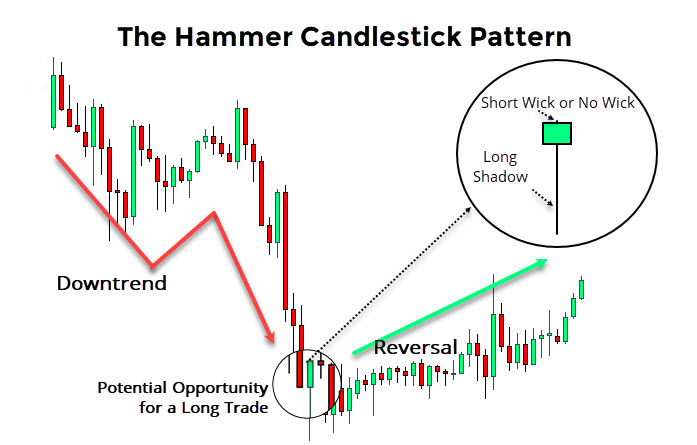
The hammer pattern is a single-candlestick pattern that suggests a potential bullish reversal, primarily occurring after a downtrend. It’s characterized by a small body, usually located at the upper end of the trading range, and a long lower wick that’s at least twice the length of the body. The upper wick, if present, is typically very short or nonexistent. The color of the body (whether bullish or bearish) is not as significant as the overall shape.
Key Characteristics of a Hammer Pattern:
- Small Body: The real body (the difference between the open and close) is relatively small.
- Long Lower Wick: The lower shadow (wick) is at least twice the length of the body. This long lower wick indicates that sellers initially drove the price down significantly, but buyers stepped in and pushed the price back up, closing near the opening price.
- Short or Absent Upper Wick: Ideally, there should be little or no upper wick.
- Preceding Downtrend: The hammer pattern is only valid if it appears after a period of price decline.
How the Hammer Pattern Forms
The formation of a hammer pattern reflects a battle between buyers and sellers. During a downtrend, sellers are in control, pushing the price lower. The long lower wick signifies a point where sellers attempted to drive the price down further, but buyers aggressively stepped in, reversing the price direction and ultimately closing near the opening price. This shows a shift in momentum, suggesting that the downtrend might be losing steam and a bullish reversal could be imminent. The length of the lower wick is crucial; the longer the wick, the stronger the potential reversal signal.
Interpreting the Hammer Pattern
While the hammer pattern provides a valuable signal, it’s not foolproof. Traders should consider several factors to confirm the potential reversal:
- Confirmation: Look for confirmation in the subsequent trading session. A bullish candle (closing higher than the hammer pattern’s close) following the hammer pattern strengthens the reversal signal.
- Volume: Higher trading volume during the hammer pattern’s formation and the subsequent confirmation candle adds further validity to the signal. Increased volume indicates stronger buying pressure.
- Support Levels: If the hammer pattern forms near a known support level, it increases the likelihood of a successful reversal. The support level acts as a floor, preventing further price decline.
- Overall Market Context: Consider the broader market conditions. A hammer pattern forming in an overall bullish market is more likely to result in a successful reversal than one forming in a bearish market.
Hammer Pattern vs. Hanging Man Pattern
It’s crucial to differentiate the hammer pattern from the hanging man pattern, which has a similar shape but a different implication. Both patterns feature a small body and a long lower wick. However, the hanging man pattern occurs after an uptrend and signals a potential bearish reversal, whereas the hammer pattern occurs after a downtrend and signals a potential bullish reversal. The context in which the pattern appears is the key differentiator.
Trading Strategies Using the Hammer Pattern
Several trading strategies can be employed using the hammer pattern. Here are a few examples:
- Entry on Confirmation: Wait for confirmation in the form of a bullish candle following the hammer pattern before entering a long position. Place a stop-loss order below the low of the hammer pattern to manage risk.
- Aggressive Entry: Enter a long position immediately after the hammer pattern forms, anticipating the bullish reversal. Use a tighter stop-loss order, placed just below the low of the hammer pattern, to limit potential losses. This strategy is riskier but offers the potential for higher profits if the reversal occurs.
- Combining with Other Indicators: Use the hammer pattern in conjunction with other technical indicators, such as moving averages, Relative Strength Index (RSI), or Moving Average Convergence Divergence (MACD), to increase the probability of a successful trade. For example, if the RSI is oversold and a hammer pattern forms, it could provide a stronger buy signal. [See also: RSI Trading Strategies]
Real-World Examples of the Hammer Pattern
To illustrate the practical application of the hammer pattern, consider the following hypothetical scenarios:
Example 1: A stock has been trending downwards for several weeks. A hammer pattern forms near a support level, with a long lower wick and a small bullish body. The following day, a bullish candle confirms the reversal. A trader could enter a long position at the close of the confirmation candle, placing a stop-loss order below the low of the hammer pattern. The target price could be set at a previous resistance level.
Example 2: A stock is in a downtrend, and a hammer pattern appears. However, the trading volume is low, and the subsequent candle is bearish. In this case, the trader should avoid entering a long position, as the signal is not strong enough. Waiting for further confirmation or a more convincing pattern is advisable.
Limitations of the Hammer Pattern
While the hammer pattern can be a valuable tool, it’s important to acknowledge its limitations:
- False Signals: The hammer pattern can sometimes generate false signals, leading to unsuccessful trades. This is why confirmation is crucial.
- Subjectivity: Identifying a hammer pattern can be subjective, as the definition of “small body” and “long lower wick” can vary from trader to trader.
- Market Volatility: In highly volatile markets, candlestick patterns can be less reliable, as price swings can be erratic.
Tips for Trading the Hammer Pattern
Here are some practical tips to enhance your trading success with the hammer pattern:
- Practice: Practice identifying hammer pattern on historical charts to improve your pattern recognition skills.
- Backtesting: Backtest your hammer pattern trading strategies to evaluate their effectiveness and identify potential weaknesses.
- Risk Management: Always use stop-loss orders to manage risk and protect your capital.
- Patience: Be patient and wait for the right opportunities. Don’t force trades based solely on the appearance of a hammer pattern.
- Continuous Learning: Stay updated with the latest market trends and trading techniques to refine your strategies.
The Inverted Hammer Pattern
It’s important to also be aware of the inverted hammer pattern. While the standard hammer signifies a potential bullish reversal after a downtrend, the inverted hammer also signals a potential bullish reversal, but its shape is inverted. It has a small body at the lower end of the trading range and a long upper wick. The lower wick is small or nonexistent. The interpretation is similar to the standard hammer: buyers are starting to exert upward pressure, potentially signaling the end of the downtrend.
Conclusion
The hammer pattern is a powerful candlestick pattern that can provide valuable insights into potential bullish reversals in the stock market. By understanding its formation, interpretation, and limitations, traders can incorporate it into their trading strategies to improve their decision-making process. Remember to always seek confirmation, consider the overall market context, and practice sound risk management principles. While the hammer pattern is a valuable tool, it should be used in conjunction with other technical indicators and analysis techniques to maximize its effectiveness. Happy trading!
