Decoding the Hammer Pattern in Stocks: A Comprehensive Guide
In the dynamic world of stock trading, identifying potential trend reversals is crucial for making informed decisions. Among the various candlestick patterns that traders use, the hammer pattern stands out as a potentially bullish signal. This article will delve into the intricacies of the hammer pattern in stocks, providing a comprehensive guide for both novice and experienced traders.
What is a Hammer Pattern?
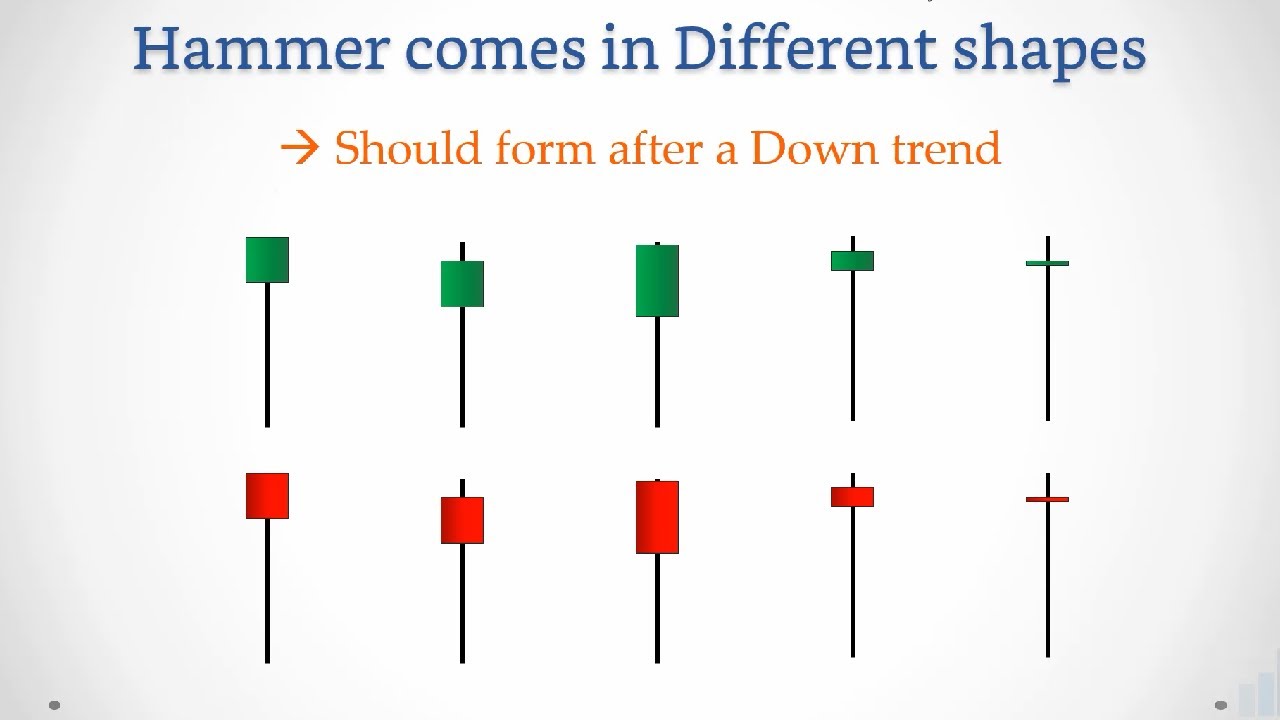
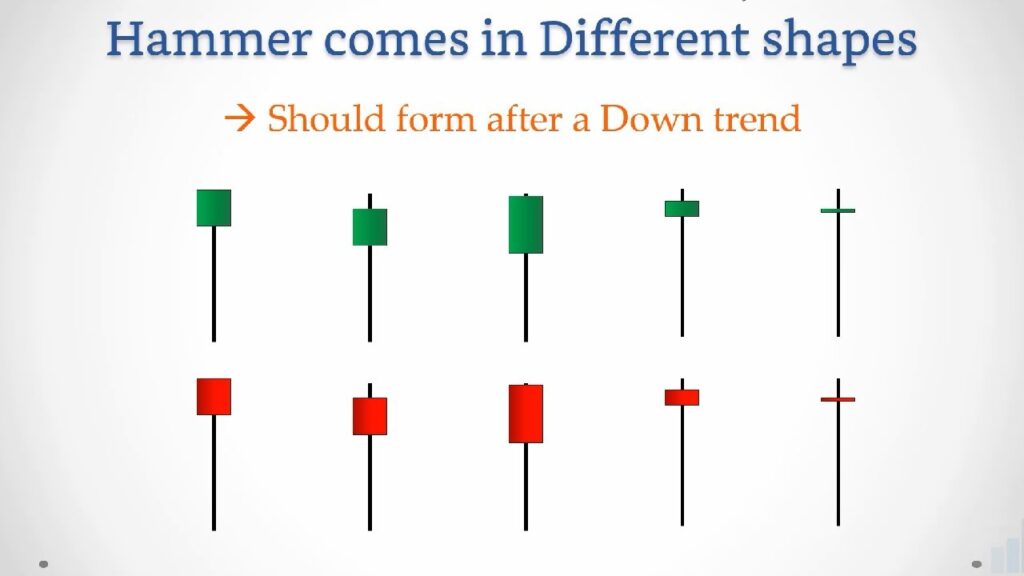
A hammer pattern is a single-candlestick pattern that appears at the end of a downtrend and suggests a potential bullish reversal. It’s characterized by a small real body (either bullish or bearish), a long lower shadow (wick) that is at least twice the length of the real body, and little or no upper shadow. The long lower shadow indicates that sellers initially drove the price lower, but buyers stepped in and pushed the price back up, suggesting a possible shift in momentum.
Key Characteristics of a Hammer Pattern
- Small Real Body: The real body represents the difference between the opening and closing prices. It can be either bullish (closing price higher than the opening price) or bearish (closing price lower than the opening price).
- Long Lower Shadow: This is the most important feature. The shadow should be at least twice the length of the real body, indicating significant buying pressure.
- Little or No Upper Shadow: Ideally, there should be little to no upper shadow. A longer upper shadow can weaken the bullish signal.
- Appears in a Downtrend: The hammer pattern is only valid if it forms after a period of declining prices.
How to Identify a Hammer Pattern on a Stock Chart
Identifying a hammer pattern requires careful observation of price charts. Here’s a step-by-step guide:
- Look for a Downtrend: The first step is to identify a stock that has been in a clear downtrend. This is essential because the hammer pattern signals a potential reversal of this downtrend.
- Identify the Candlestick: Scan the chart for a candlestick with a small real body, a long lower shadow (at least twice the length of the real body), and little or no upper shadow.
- Consider the Context: The context in which the hammer pattern appears is crucial. Look for other confirming indicators, such as volume or support levels.
- Confirm with Subsequent Price Action: The hammer pattern is not a guaranteed signal. It’s important to wait for confirmation from subsequent price action. A bullish confirmation would be a close above the high of the hammer pattern candlestick on the following day.
The Psychology Behind the Hammer Pattern
Understanding the psychology behind the hammer pattern can enhance your ability to interpret its significance. During a downtrend, sellers are in control, pushing the price lower. The long lower shadow of the hammer pattern represents a test of lower prices. When buyers step in and aggressively push the price back up, it signals a potential shift in sentiment. This suggests that the selling pressure may be weakening, and buyers are gaining control.
The small real body further reinforces this idea. Even if the closing price is lower than the opening price (a bearish hammer pattern), the fact that the price recovered significantly from its low indicates strong buying interest. A bullish hammer pattern, where the closing price is higher than the opening price, provides even stronger confirmation of a potential reversal.
Hammer Pattern vs. Hanging Man Pattern
It’s important to distinguish the hammer pattern from the hanging man pattern, as they look similar but have opposite implications. The hanging man pattern also has a small real body and a long lower shadow, but it appears at the end of an uptrend and signals a potential bearish reversal. The key difference lies in the preceding trend. A hammer pattern appears after a downtrend, while a hanging man pattern appears after an uptrend. [See also: Understanding Candlestick Patterns]
Trading Strategies Using the Hammer Pattern
The hammer pattern can be a valuable tool in your trading arsenal, but it’s essential to use it in conjunction with other indicators and risk management techniques. Here are some trading strategies to consider:
Confirmation is Key
Never trade solely based on the hammer pattern alone. Always wait for confirmation from subsequent price action. A common confirmation signal is a close above the high of the hammer pattern candlestick on the following day. This confirms that buyers are indeed in control and that the downtrend may be over.
Use Stop-Loss Orders
Protect your capital by using stop-loss orders. A common strategy is to place the stop-loss order just below the low of the hammer pattern candlestick. This limits your potential losses if the price continues to decline.
Combine with Other Indicators
Enhance the reliability of the hammer pattern by combining it with other technical indicators, such as:
- Volume: Look for increased volume on the day the hammer pattern forms. This can indicate stronger buying pressure.
- Moving Averages: Use moving averages to identify potential support and resistance levels. A hammer pattern that forms near a key support level is a stronger signal.
- Relative Strength Index (RSI): The RSI can help identify oversold conditions. A hammer pattern that forms when the RSI is below 30 (oversold) can be a more reliable signal.
- Fibonacci Retracement Levels: Look for hammer pattern formations at key Fibonacci retracement levels to confirm potential support zones.
Example Trading Scenario
Let’s say you’re analyzing a stock and you identify a hammer pattern after a significant downtrend. The hammer pattern has a small real body, a long lower shadow, and little to no upper shadow. To confirm the signal, you wait for the next day’s candlestick to close above the high of the hammer pattern. You also notice that the volume was higher than average on the day the hammer pattern formed. This provides further confirmation that buyers are stepping in. You decide to enter a long position, placing your stop-loss order just below the low of the hammer pattern. You set a profit target based on a previous resistance level or a Fibonacci retracement level.
Limitations of the Hammer Pattern
While the hammer pattern can be a valuable tool, it’s important to be aware of its limitations:
- False Signals: Like all technical indicators, the hammer pattern can produce false signals. Not every hammer pattern will result in a bullish reversal.
- Subjectivity: Identifying a hammer pattern can be subjective. Different traders may interpret the same candlestick differently.
- Market Context: The effectiveness of the hammer pattern can vary depending on the overall market conditions. In a strong bear market, even a valid hammer pattern may not be enough to trigger a sustained rally.
Hammer Pattern Variations
While the classic hammer pattern is easily recognizable, variations exist. These variations may still indicate potential bullish reversals, but it’s important to analyze them carefully.
Inverted Hammer
The inverted hammer is a bullish reversal pattern that looks like an upside-down hammer. It has a small real body, a long upper shadow, and little or no lower shadow. The long upper shadow indicates that buyers initially pushed the price higher, but sellers stepped in and pushed it back down. However, the fact that buyers were able to drive the price up at all suggests that selling pressure may be weakening.
Hanging Man (Again!)
As mentioned previously, the hanging man looks similar to the hammer pattern but appears at the end of an uptrend. It signals a potential bearish reversal. It’s crucial to differentiate between the two based on the preceding trend.
Real-World Examples of the Hammer Pattern
To better understand the hammer pattern, let’s look at some real-world examples on stock charts. (Note: Specific examples would require access to live stock charts and cannot be provided here, but you can easily find examples on financial websites or trading platforms). Look for instances where a hammer pattern formed after a downtrend and was followed by a bullish reversal. Analyze the volume, other indicators, and the overall market context to assess the reliability of the signal.
Conclusion
The hammer pattern is a valuable tool for identifying potential bullish reversals in stocks. By understanding its characteristics, psychology, and limitations, you can incorporate it into your trading strategy to make more informed decisions. Remember to always wait for confirmation, use stop-loss orders, and combine the hammer pattern with other indicators to enhance its reliability. While no indicator is foolproof, a well-understood and carefully applied hammer pattern can provide a significant edge in the stock market. Always remember to conduct thorough research and consider consulting with a financial advisor before making any investment decisions. The hammer pattern is just one piece of the puzzle; responsible investing requires a holistic approach. The hammer pattern can be a powerful signal when used correctly. Proper risk management when trading the hammer pattern is crucial. Understanding the hammer pattern can improve trading outcomes. Many successful traders use the hammer pattern daily.
