Decoding the Red Hammer Candle: A Comprehensive Guide for Traders
The financial markets are filled with patterns and signals that can offer insights into potential price movements. Among these, candlestick patterns are particularly popular due to their visual appeal and ease of interpretation. One such pattern is the red hammer candle. This article provides a comprehensive overview of the red hammer candle, its characteristics, how to identify it, its implications for traders, and how to use it effectively in your trading strategy.
What is a Hammer Candle?
Before diving into the specifics of the red hammer candle, it’s crucial to understand the basics of a hammer candle in general. A hammer is a bullish reversal pattern that forms after a downtrend. It’s characterized by a small body near the high of the trading range and a long lower shadow (or wick) that is at least twice the length of the body. The upper shadow, if present, is typically very small or nonexistent.
Key Characteristics of a Hammer Candle:
- Small Body: The real body (the difference between the open and close price) is small.
- Long Lower Shadow: The lower shadow is significantly longer than the body, indicating that the price tested lower levels before buyers stepped in to push the price back up.
- Upper Shadow: Ideally, the upper shadow is small or nonexistent.
- Prior Downtrend: The hammer appears after a period of declining prices.
The Red Hammer Candle: Specifics
The red hammer candle is a variation of the standard hammer candle where the body is red (or bearish). This means that the closing price is lower than the opening price, albeit only slightly. While the color might initially seem contradictory for a bullish reversal pattern, it’s the overall shape and context that matter most. The red hammer candle still signals a potential reversal of the downtrend, as the long lower shadow indicates strong buying pressure.
The color of the body (red or green) is less important than the presence of the long lower shadow and the preceding downtrend. However, some traders may view a green hammer as slightly more bullish than a red hammer candle, as it indicates that buyers were able to push the price higher than the opening price.
How to Identify a Red Hammer Candle
Identifying a red hammer candle involves looking for the following criteria on a price chart:
- Preceding Downtrend: Ensure that the candle appears after a clear downtrend. This is crucial for the pattern to be valid.
- Small Red Body: The body of the candle should be small and red, indicating a slight bearish sentiment.
- Long Lower Shadow: The lower shadow should be at least twice the length of the body.
- Small or No Upper Shadow: The upper shadow should be minimal or absent.
It’s important to note that not all candles that resemble a hammer are valid signals. The context in which the candle appears is just as important as its shape. A hammer-like candle appearing in an uptrend, for example, is not a valid hammer pattern.
The Psychology Behind the Red Hammer Candle
Understanding the psychology behind the red hammer candle can provide valuable insights into its potential effectiveness. The pattern reflects a battle between buyers and sellers. During the trading period, sellers initially pushed the price down significantly, creating the long lower shadow. However, buyers then stepped in and managed to push the price back up towards the opening price, resulting in the small body. This indicates that buyers are starting to gain control, and the downtrend may be losing momentum.
The fact that the body is red suggests that the sellers still had some influence, but the overall strength of the buying pressure is evident from the long lower shadow. This creates a sense of uncertainty among sellers and encourages buyers to enter the market, potentially leading to a reversal of the downtrend.
Trading Strategies Using the Red Hammer Candle
The red hammer candle can be a valuable tool in your trading arsenal, but it’s important to use it in conjunction with other technical indicators and risk management techniques. Here are some strategies for trading with the red hammer candle:
Confirmation is Key
Never trade solely based on the appearance of a red hammer candle. Always wait for confirmation from subsequent price action. A common confirmation signal is a bullish candle that closes above the high of the hammer candle. This confirms that buyers have indeed taken control and that the reversal is likely to continue. Without confirmation, the hammer could be a false signal.
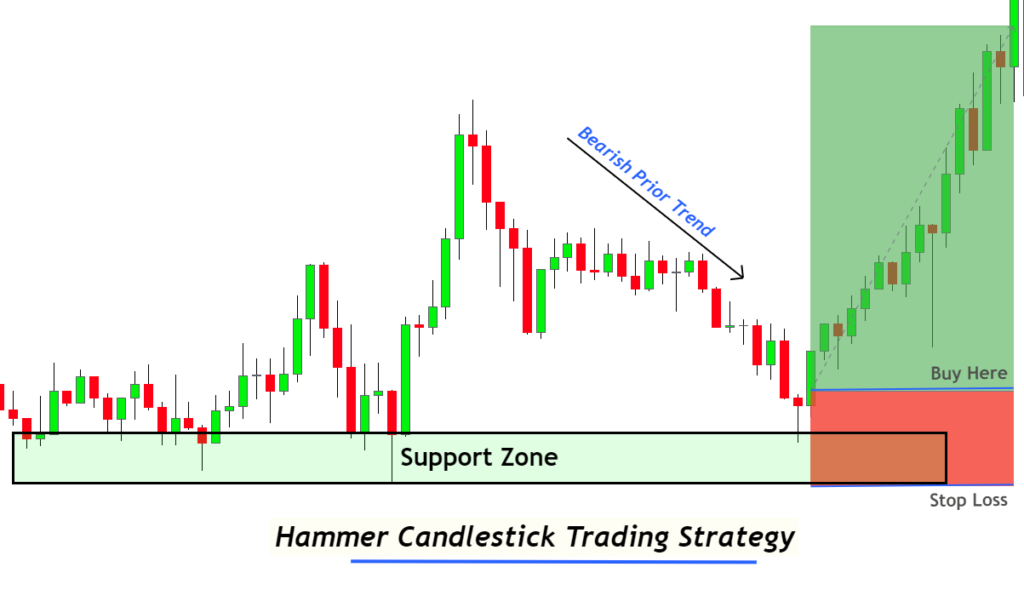
Combine with Support and Resistance Levels
The effectiveness of a red hammer candle is enhanced when it appears near a key support level. If the hammer forms at a support level, it indicates that buyers are defending that level, increasing the likelihood of a reversal. Similarly, consider resistance levels as potential targets for your trades. [See also: Identifying Support and Resistance Levels]
Use with Other Technical Indicators
Combine the red hammer candle with other technical indicators, such as moving averages, RSI (Relative Strength Index), and MACD (Moving Average Convergence Divergence), to get a more comprehensive view of the market. For example, if the RSI is oversold and a red hammer candle appears, it could be a strong indication of a potential reversal. Divergence between price and an oscillator can also add confluence.
Stop-Loss Placement
Proper stop-loss placement is crucial for managing risk when trading with the red hammer candle. A common approach is to place the stop-loss just below the low of the hammer candle. This limits your potential losses if the reversal fails to materialize.
Profit Target
Determine your profit target based on your risk-reward ratio and the overall market conditions. Consider using Fibonacci retracement levels or previous resistance levels as potential targets. A common approach is to aim for a risk-reward ratio of at least 1:2 or 1:3.
Examples of Red Hammer Candles in Trading
Let’s consider a hypothetical example. Imagine you are analyzing the daily chart of a stock that has been in a downtrend for several weeks. You notice a red hammer candle forming near a known support level. The lower shadow is long, and the body is small and red. To confirm the signal, you wait for the next day’s candle to close above the high of the hammer. If it does, you enter a long position with a stop-loss just below the low of the hammer and a profit target based on a 1:2 risk-reward ratio.
Another example might involve using the red hammer candle in conjunction with the RSI. If the RSI is below 30 (indicating an oversold condition) and a red hammer candle appears, it could be a strong buy signal. You would still wait for confirmation before entering the trade, and you would manage your risk with a stop-loss order.
Limitations of the Red Hammer Candle
While the red hammer candle can be a useful tool, it’s important to be aware of its limitations:
- False Signals: Like all technical indicators, the red hammer candle can produce false signals. It’s crucial to wait for confirmation and to use other indicators to validate the signal.
- Subjectivity: Identifying a red hammer candle can be subjective. Different traders may interpret the same candle differently.
- Market Context: The effectiveness of the red hammer candle depends on the overall market context. It may be less reliable in volatile or choppy markets.
- Not a Holy Grail: The red hammer candle is not a foolproof trading strategy. It should be used as part of a comprehensive trading plan that includes risk management and position sizing.
Conclusion
The red hammer candle is a valuable candlestick pattern that can provide insights into potential bullish reversals. By understanding its characteristics, identifying it correctly, and using it in conjunction with other technical indicators and risk management techniques, traders can improve their trading performance. Remember to always wait for confirmation and to be aware of the limitations of the pattern. The red hammer candle, when used wisely, can be a powerful addition to your trading toolbox, providing valuable clues about market sentiment and potential price movements. Understanding the nuances of a red hammer candle can give traders an edge in navigating the complexities of the financial markets. Always backtest and paper trade before using any new strategy with real capital. Further research into candlestick patterns and other technical analysis tools is highly recommended to enhance your trading skills. The red hammer candle is just one piece of the puzzle, but a crucial one for many traders.
