Decoding the Red Hammer Candle: A Comprehensive Guide for Traders
The financial markets are a complex landscape, filled with patterns and signals that can guide traders toward profitable decisions. Among the most recognizable and potentially lucrative of these signals is the red hammer candle. This article provides a comprehensive overview of the red hammer candle, exploring its characteristics, significance, and how to effectively incorporate it into your trading strategy. Understanding the nuances of this candlestick pattern can significantly enhance your ability to identify potential market reversals and make informed trading choices.
What is a Red Hammer Candle?
A red hammer candle is a single candlestick pattern that appears on a price chart, signaling a potential bullish reversal in a downtrend. It is characterized by a small body, a long lower wick (or shadow), and little to no upper wick. The color of the body is red, indicating that the closing price was lower than the opening price for that period. The long lower wick suggests that during the trading period, the price initially moved significantly lower but then rallied back up to close near the opening price. This indicates strong buying pressure and a potential shift in market sentiment.
Key Characteristics of a Red Hammer Candle:
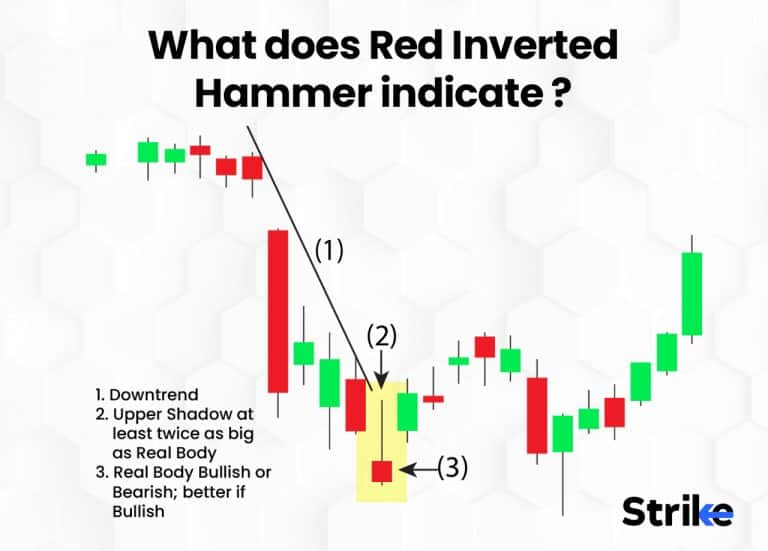
- Small Body: The real body (the difference between the open and close) is relatively small.
- Long Lower Wick: The lower wick is at least twice the length of the real body.
- Little or No Upper Wick: Ideally, there should be little to no upper wick.
- Red Body: The candle body is red, indicating a closing price lower than the opening price.
Understanding the Psychology Behind the Red Hammer Candle
The red hammer candle visually represents a battle between the bears (sellers) and the bulls (buyers). During the trading period, the bears initially drive the price lower, creating the long lower wick. However, the bulls then step in and aggressively buy, pushing the price back up towards the opening price. The fact that the price closes near the opening price, despite the significant downward pressure, suggests that the bulls are gaining control of the market. This shift in momentum can signal the end of the downtrend and the beginning of a potential uptrend.
Red Hammer vs. Green Hammer Candle
While both red hammer candles and green hammer candles share the same basic structure (small body, long lower wick), the color of the body provides additional information. A green hammer candle indicates that the closing price was higher than the opening price, further strengthening the bullish signal. A red hammer candle, while still bullish, suggests that the buying pressure wasn’t quite strong enough to push the price above the opening price. However, the long lower wick remains the key indicator of potential reversal, regardless of the body color.
Identifying the Red Hammer Candle on a Chart
To effectively use the red hammer candle in your trading strategy, you need to be able to identify it accurately on a price chart. Here’s a step-by-step guide:
- Identify a Downtrend: The red hammer candle is most effective when it appears at the end of a downtrend. Look for a series of lower highs and lower lows.
- Look for the Candlestick Pattern: Scan the chart for a candlestick with a small body, a long lower wick (at least twice the length of the body), and little to no upper wick.
- Confirm the Downtrend: Ensure that the candlestick appears within a clear downtrend.
Trading Strategies Using the Red Hammer Candle
Once you’ve identified a red hammer candle, you can use it to inform your trading decisions. Here are a few common strategies:
Entry Points
The most common approach is to enter a long position (buy) after the red hammer candle has formed, waiting for confirmation from the next candle. A break above the high of the hammer candle can be used as an entry trigger. Some traders might enter at the close of the hammer candle, but this is riskier as it lacks confirmation.
Stop-Loss Placement
Proper stop-loss placement is crucial for managing risk. A common strategy is to place the stop-loss order just below the low of the red hammer candle. This protects your position if the price continues to decline instead of reversing upwards.
Profit Targets
Determining profit targets depends on your risk tolerance and trading style. One approach is to use Fibonacci retracement levels to identify potential resistance areas where you might consider taking profits. Another approach is to set a profit target based on a multiple of your risk (e.g., aiming for a 2:1 or 3:1 risk-reward ratio).
Confirmation is Key
While the red hammer candle can be a powerful signal, it’s important to remember that it’s not foolproof. It’s crucial to seek confirmation from other technical indicators or price action before entering a trade. Confirmation can come in the form of:
- A Bullish Candle Following the Hammer: A green candle that closes above the high of the hammer candle provides strong confirmation of the bullish reversal.
- Increased Volume: A surge in trading volume on the hammer candle or the subsequent candle can indicate strong buying pressure.
- Support Levels: If the hammer candle forms near a known support level, it strengthens the likelihood of a reversal.
- Other Technical Indicators: Indicators like the Relative Strength Index (RSI) or Moving Average Convergence Divergence (MACD) can provide additional confirmation of the bullish signal. [See also: RSI Trading Strategies]
Limitations of the Red Hammer Candle
Like any technical indicator, the red hammer candle has its limitations. It’s important to be aware of these limitations to avoid making costly trading errors:
- False Signals: The red hammer candle can sometimes generate false signals, especially in volatile markets.
- Subjectivity: Identifying a red hammer candle can be subjective, as different traders may have different interpretations of what constitutes a valid hammer pattern.
- Context is Crucial: The effectiveness of the red hammer candle depends heavily on the context in which it appears. It’s important to consider the overall market trend and other technical factors before acting on the signal.
Examples of Red Hammer Candle in Action
Let’s consider a hypothetical example. Imagine you are tracking the stock price of XYZ Corp. The stock has been in a downtrend for several weeks. Suddenly, you spot a red hammer candle forming near a support level. The lower wick of the candle is significantly longer than the body, and there’s little to no upper wick. This suggests that the bears are losing control and the bulls are starting to step in. You wait for confirmation from the next candle, which closes above the high of the hammer candle. You then enter a long position with a stop-loss order placed just below the low of the hammer candle. Over the next few days, the stock price rallies, and you reach your profit target, resulting in a successful trade.
Another scenario might involve a red hammer candle appearing, but without subsequent confirmation. In this case, the trader would avoid entering a long position, preventing a potential loss if the price continued to decline.
Combining the Red Hammer Candle with Other Indicators
To increase the reliability of the red hammer candle signal, it’s often beneficial to combine it with other technical indicators. Here are a few examples:
- Moving Averages: Using moving averages to identify the overall trend can help filter out false signals. A red hammer candle that forms near a rising moving average is more likely to be a valid bullish reversal signal.
- Fibonacci Retracement Levels: As mentioned earlier, Fibonacci retracement levels can be used to identify potential support and resistance areas. A red hammer candle that forms near a Fibonacci retracement level can strengthen the likelihood of a reversal. [See also: Fibonacci Trading Strategies]
- Volume Analysis: Analyzing trading volume can provide additional insights into the strength of the bullish signal. A surge in volume on the hammer candle or the subsequent candle can indicate strong buying pressure.
Conclusion: Mastering the Red Hammer Candle
The red hammer candle is a valuable tool for traders looking to identify potential bullish reversals in downtrends. By understanding its characteristics, significance, and limitations, you can effectively incorporate it into your trading strategy and improve your chances of success. Remember to always seek confirmation from other technical indicators or price action before entering a trade, and to manage your risk with proper stop-loss placement. With practice and experience, you can master the art of decoding the red hammer candle and use it to make informed trading decisions. The **red hammer candle** is a powerful indicator when used correctly. Don’t underestimate the power of the **red hammer candle**. The **red hammer candle** can be your friend. Always study the **red hammer candle**. The **red hammer candle** is a key pattern. Learning about the **red hammer candle** is worthwhile. The **red hammer candle** needs to be practiced. Use the **red hammer candle** wisely. The **red hammer candle** should be part of your toolkit. Use the **red hammer candle** in conjunction with other indicators. Understanding the **red hammer candle** takes time. Don’t rush when learning about the **red hammer candle**. The **red hammer candle** is a good starting point. The **red hammer candle** is important to understand.
