Decoding the Red Hammer Candle: A Trader’s Guide to Spotting Reversal Signals
In the dynamic world of financial markets, identifying potential trend reversals is crucial for successful trading. Among the various candlestick patterns used by traders, the red hammer candle stands out as a significant indicator. This article delves into the intricacies of the red hammer candle, exploring its formation, interpretation, and implications for traders seeking to capitalize on market shifts. Understanding this pattern can provide valuable insights into potential buying opportunities and help traders make more informed decisions.
What is a Hammer Candlestick Pattern?
Before focusing specifically on the red hammer candle, it’s essential to understand the broader concept of the hammer candlestick pattern. A hammer is a bullish reversal pattern that forms after a downtrend, signaling a potential shift in market sentiment from bearish to bullish. It is characterized by a small body, a long lower shadow (or wick), and little to no upper shadow. The long lower shadow indicates that sellers initially pushed the price lower during the trading period, but buyers stepped in and drove the price back up, closing near the opening price.
The hammer pattern suggests that the downtrend might be losing momentum, and buyers are starting to gain control. However, it’s important to note that the hammer alone doesn’t guarantee a reversal. Confirmation from subsequent price action is often required to validate the signal.
The Red Hammer Candle: Specific Characteristics
A red hammer candle is a specific type of hammer candlestick pattern where the body of the candle is red (or bearish). This means that the closing price is lower than the opening price for that particular trading period. The color of the body adds another layer of information to the interpretation of the pattern.
Despite the bearish body, the red hammer candle still suggests a potential bullish reversal. The long lower shadow indicates that buyers were able to overcome the selling pressure and push the price back up, even though they couldn’t completely erase the initial downward movement. The fact that the closing price is still near the opening price, despite being lower, demonstrates the strength of the buying pressure.
Key Characteristics of a Red Hammer:
- Small Red Body: The body of the candle is relatively small compared to the overall length of the candle.
- Long Lower Shadow: The lower shadow should be at least twice the length of the body. This signifies strong buying pressure.
- Little to No Upper Shadow: Ideally, the candle should have little to no upper shadow. A significant upper shadow weakens the bullish signal.
- Appears After a Downtrend: The red hammer candle is only valid as a reversal signal when it appears after a sustained downtrend.
Interpreting the Red Hammer Candle: A Deeper Dive
Interpreting the red hammer candle requires a nuanced understanding of market dynamics. While the pattern suggests a potential bullish reversal, it’s crucial to consider other factors before making trading decisions.
Factors to Consider:
- Volume: High trading volume during the formation of the red hammer candle strengthens the signal. Increased volume indicates strong participation from buyers.
- Confirmation: Confirmation is essential. A bullish candle that closes above the high of the red hammer candle in the subsequent trading period provides confirmation of the reversal.
- Support Levels: If the red hammer candle forms near a key support level, it further reinforces the potential for a reversal.
- Overall Market Trend: Consider the broader market trend. A red hammer candle forming in an overall bullish market may be less significant than one forming in a bearish market.
- Other Indicators: Use other technical indicators, such as moving averages, RSI, and MACD, to confirm the signal provided by the red hammer candle.
Trading Strategies Using the Red Hammer Candle
Several trading strategies can be employed using the red hammer candle as a signal. Here are a few common approaches:
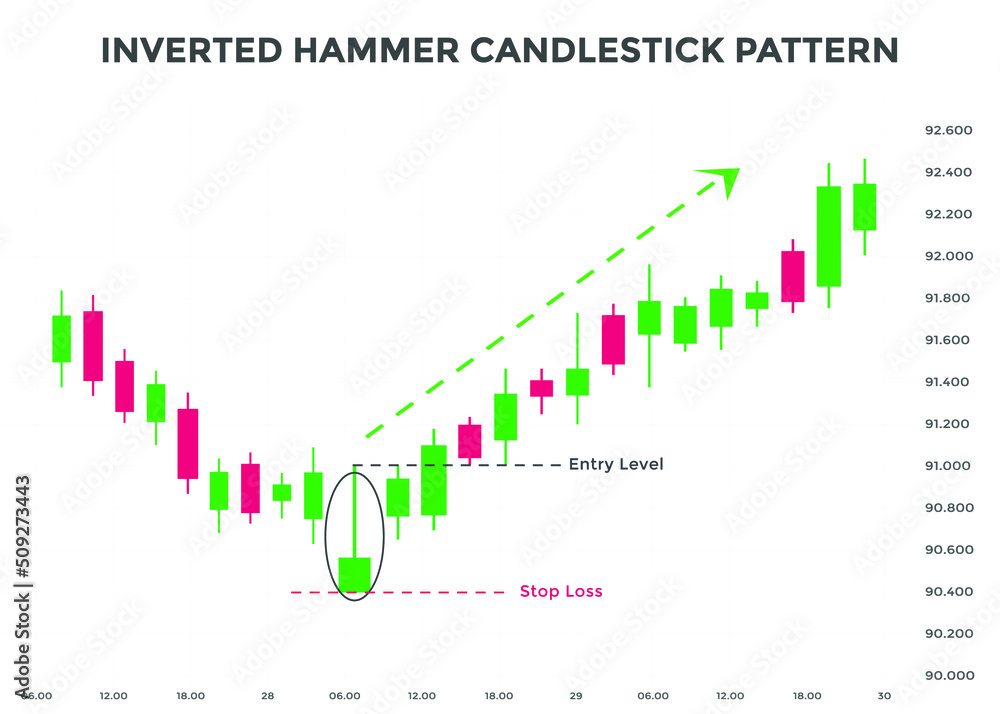
Entry Points:
- Aggressive Entry: Enter a long position immediately after the close of the confirming candle (the candle that closes above the high of the red hammer candle).
- Conservative Entry: Wait for a pullback to the high of the red hammer candle before entering a long position. This provides a more favorable risk-reward ratio.
Stop-Loss Placement:
- Below the Low of the Hammer: Place the stop-loss order slightly below the low of the red hammer candle. This protects against a false breakout.
- Below a Key Support Level: If the red hammer candle forms near a key support level, place the stop-loss order below that support level.
Profit Targets:
- Previous Resistance Levels: Set profit targets at previous resistance levels.
- Fibonacci Extensions: Use Fibonacci extensions to identify potential profit targets based on the size of the previous downtrend.
- Risk-Reward Ratio: Aim for a favorable risk-reward ratio of at least 1:2 or 1:3.
Red Hammer vs. Green Hammer
While both red hammer candle and green hammer candles signal potential bullish reversals, the color of the body can provide subtle nuances. A green hammer indicates that the closing price is higher than the opening price, suggesting stronger buying pressure. However, a red hammer candle still indicates a potential reversal, albeit with slightly less initial bullish momentum. The key factor remains the long lower shadow, which signifies that buyers were able to overcome significant selling pressure.
Limitations of the Red Hammer Candle
Despite its usefulness as a reversal indicator, the red hammer candle has certain limitations:
- False Signals: The red hammer candle can generate false signals, especially in volatile markets.
- Lack of Confirmation: Without confirmation from subsequent price action, the red hammer candle may not be a reliable indicator.
- Subjectivity: Identifying a red hammer candle can be subjective, as the length of the lower shadow and the size of the body may vary.
- Market Context: The effectiveness of the red hammer candle depends on the overall market context and the specific asset being traded.
Real-World Examples of the Red Hammer Candle
To illustrate the practical application of the red hammer candle, let’s consider a few hypothetical examples:
Example 1: Stock XYZ
Stock XYZ has been in a downtrend for several weeks. A red hammer candle forms near a key support level. The lower shadow is significantly longer than the body, and trading volume is high. The subsequent candle closes above the high of the red hammer candle, confirming the reversal. A trader enters a long position with a stop-loss order placed below the low of the hammer. The profit target is set at the previous resistance level.
Example 2: Forex Pair EUR/USD
The EUR/USD currency pair has been declining steadily. A red hammer candle forms on the daily chart. The long lower shadow indicates strong buying pressure. The trader waits for confirmation before entering a long position. A bullish engulfing candle forms the next day, confirming the reversal. The trader places a stop-loss order below the low of the hammer and sets a profit target based on Fibonacci extensions.
Conclusion: Mastering the Red Hammer Candle
The red hammer candle is a valuable tool for traders seeking to identify potential bullish reversals in the market. By understanding its formation, interpretation, and limitations, traders can incorporate this pattern into their trading strategies and make more informed decisions. Remember to always consider other factors, such as volume, confirmation, and overall market context, before acting on the signal provided by the red hammer candle. While the red hammer candle can be a powerful indicator, it should be used in conjunction with other technical analysis tools and risk management techniques to maximize its effectiveness. The ability to recognize and correctly interpret a red hammer candle can significantly improve a trader’s ability to spot profitable opportunities. Always practice responsible trading and manage your risk appropriately. The red hammer candle, when used correctly, is a valuable asset in a trader’s arsenal. Understanding the nuances of the red hammer candle and its implications for market sentiment can give traders a competitive edge. By combining this knowledge with sound risk management and a comprehensive trading plan, traders can increase their chances of success in the financial markets. [See also: Understanding Candlestick Patterns]
