Decoding the Red Hammer Candlestick: A Comprehensive Guide for Traders
The red hammer candlestick pattern is a vital tool in the arsenal of any technical trader. It provides a visual representation of potential trend reversals, offering insights into market sentiment and possible future price movements. This comprehensive guide will delve into the intricacies of the red hammer candlestick, exploring its formation, interpretation, confirmation, and limitations. Understanding the nuances of this pattern can significantly enhance your trading strategy and improve your decision-making process.
Understanding Candlestick Patterns
Before diving into the specifics of the red hammer candlestick, it’s crucial to understand the basics of candlestick patterns. Candlesticks are graphical representations of price movements for a specific period. Each candlestick conveys information about the open, high, low, and close prices.
- Body: The body represents the range between the open and close prices. A filled or colored body (often red or black) indicates that the closing price was lower than the opening price, signifying a bearish period. An empty or white body indicates that the closing price was higher than the opening price, signifying a bullish period.
- Wicks (Shadows): The wicks, also known as shadows, represent the highest and lowest prices reached during the period. The upper wick extends from the top of the body to the highest price, while the lower wick extends from the bottom of the body to the lowest price.
What is a Red Hammer Candlestick?
The red hammer candlestick is a bullish reversal pattern that forms after a downtrend. It’s characterized by a small body located at the upper end of the trading range and a long lower wick that’s at least twice the length of the body. The color of the body (red in this case) is less important than the overall shape. The key characteristics of a red hammer candlestick are:
- Small Body: The real body is small, indicating that the opening and closing prices were relatively close.
- Long Lower Wick: The lower wick is significantly longer than the body, showing that prices declined sharply during the period but then recovered to close near the opening price.
- Little or No Upper Wick: Ideally, the hammer should have little or no upper wick. A significant upper wick can weaken the bullish signal.
- Appears After a Downtrend: The red hammer candlestick is only valid when it forms after a defined downtrend.
The red hammer candlestick suggests that despite strong selling pressure during the period, buyers stepped in and pushed the price back up, indicating a potential shift in momentum. This signals that the downtrend may be losing steam, and a bullish reversal could be imminent.
Interpretation of the Red Hammer Candlestick
The red hammer candlestick pattern indicates a potential bullish reversal. Here’s a breakdown of how to interpret its signals:
- Downtrend Precedes the Pattern: The pattern is only significant if it occurs after a downtrend. A downtrend provides context for the potential reversal.
- Long Lower Wick Shows Buying Pressure: The long lower wick demonstrates that sellers initially dominated the trading session, pushing the price down significantly. However, buyers then entered the market and drove the price back up, indicating strong buying pressure.
- Small Body Indicates Indecision: The small body suggests that the bulls and bears are in a state of equilibrium. However, the fact that the price closed near the opening price, after the earlier decline, favors the bulls.
- Potential Trend Reversal: The overall pattern suggests that the downtrend may be losing momentum and that a bullish reversal is possible.
Confirmation of the Red Hammer Candlestick
While the red hammer candlestick can be a valuable signal, it’s essential to confirm the pattern before making any trading decisions. Confirmation is crucial to avoid false signals and increase the probability of a successful trade. Here are several methods for confirming a red hammer candlestick pattern:
- Bullish Candle on the Next Day: The most common confirmation method is to look for a bullish candlestick on the day following the hammer. This candle should close above the closing price of the hammer. This confirms that the buying pressure observed in the hammer pattern is continuing.
- Increased Trading Volume: A significant increase in trading volume on the day the hammer forms, or on the confirmation day, adds further validity to the pattern. Higher volume indicates stronger conviction among buyers.
- Moving Averages: Observe how the hammer pattern interacts with key moving averages. If the hammer forms near or above a moving average, it can act as support and strengthen the bullish signal.
- Fibonacci Retracement Levels: Look for the hammer to form near a Fibonacci retracement level. If the hammer coincides with a Fibonacci level, it can act as a support level and increase the likelihood of a reversal.
- Other Technical Indicators: Combine the hammer pattern with other technical indicators such as the Relative Strength Index (RSI) or Moving Average Convergence Divergence (MACD). These indicators can provide additional confirmation of a potential reversal. For example, if the RSI is oversold when the hammer forms, it can further support the bullish signal.
Examples of Red Hammer Candlestick in Trading
Let’s examine a few hypothetical examples of how to identify and trade the red hammer candlestick pattern:
Example 1: Stock Trading
Imagine you’re tracking a stock that has been in a consistent downtrend for several weeks. Suddenly, you notice a red hammer candlestick forming at the end of the downtrend. The hammer has a small body and a long lower wick, with little or no upper wick. To confirm the pattern, you wait for the next day and observe a bullish candlestick that closes above the closing price of the hammer. Additionally, you notice that the trading volume on the hammer day was significantly higher than average. Based on this confirmation, you decide to enter a long position, anticipating a bullish reversal.
Example 2: Forex Trading
Consider a currency pair that has been trending downwards for a considerable period. You spot a red hammer candlestick forming on the daily chart. The hammer’s long lower wick indicates strong buying pressure. To confirm the pattern, you check the RSI, which shows that the currency pair is oversold. You also notice that the hammer formed near a Fibonacci retracement level. With these confirmations in place, you decide to open a buy order, expecting the downtrend to reverse.
Limitations of the Red Hammer Candlestick
While the red hammer candlestick can be a powerful tool, it’s essential to be aware of its limitations:
- False Signals: Like any technical indicator, the hammer pattern can produce false signals. It’s crucial to confirm the pattern using other indicators and analysis techniques.
- Subjectivity: Identifying a hammer pattern can be subjective. Different traders may interpret the pattern differently based on their own biases and experience.
- Market Context: The effectiveness of the hammer pattern depends on the overall market context. In a strong trending market, the pattern may be less reliable.
- Timeframe Dependency: The hammer pattern may be more reliable on higher timeframes (e.g., daily, weekly) than on lower timeframes (e.g., hourly, 15-minute).
Red Hammer Candlestick vs. Other Candlestick Patterns
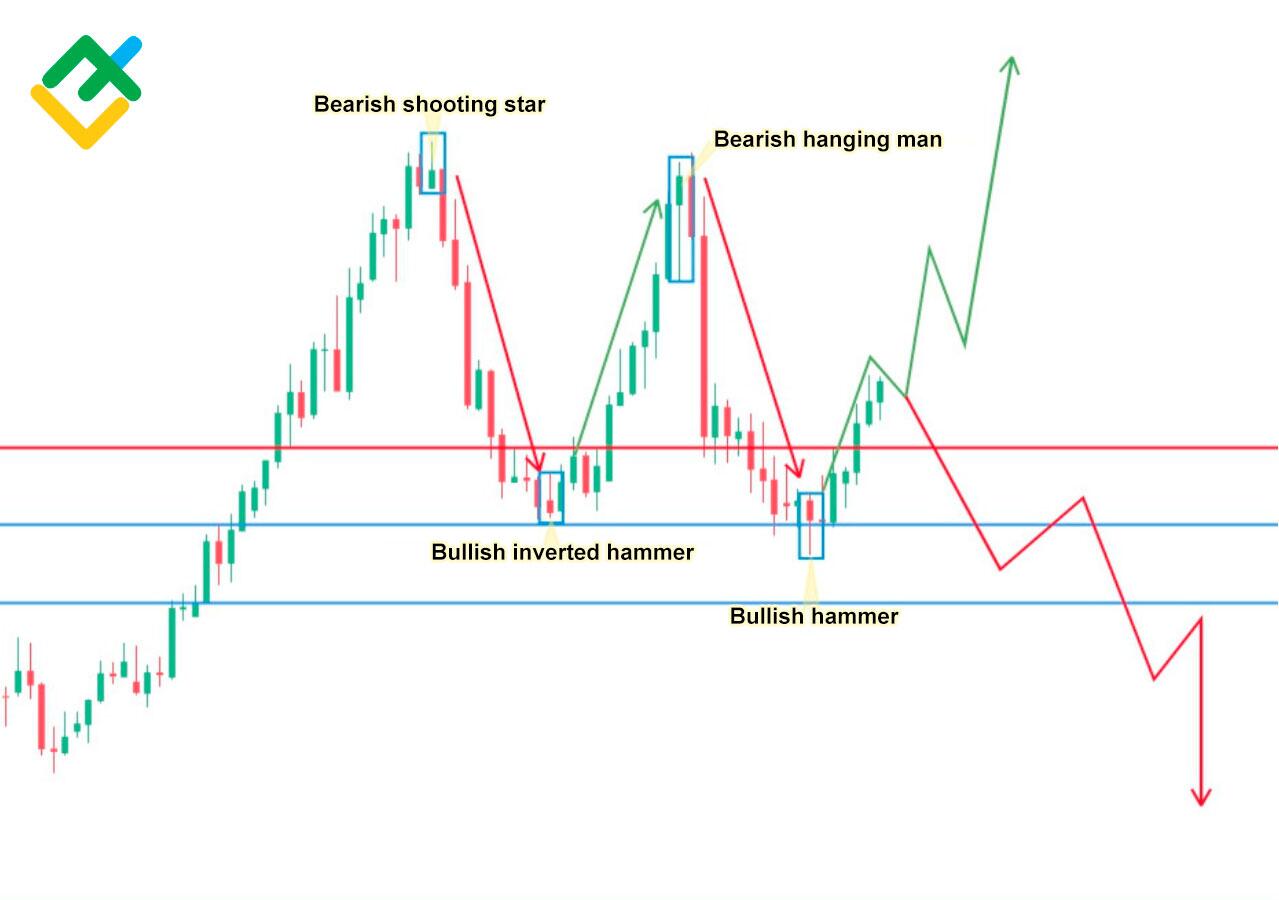
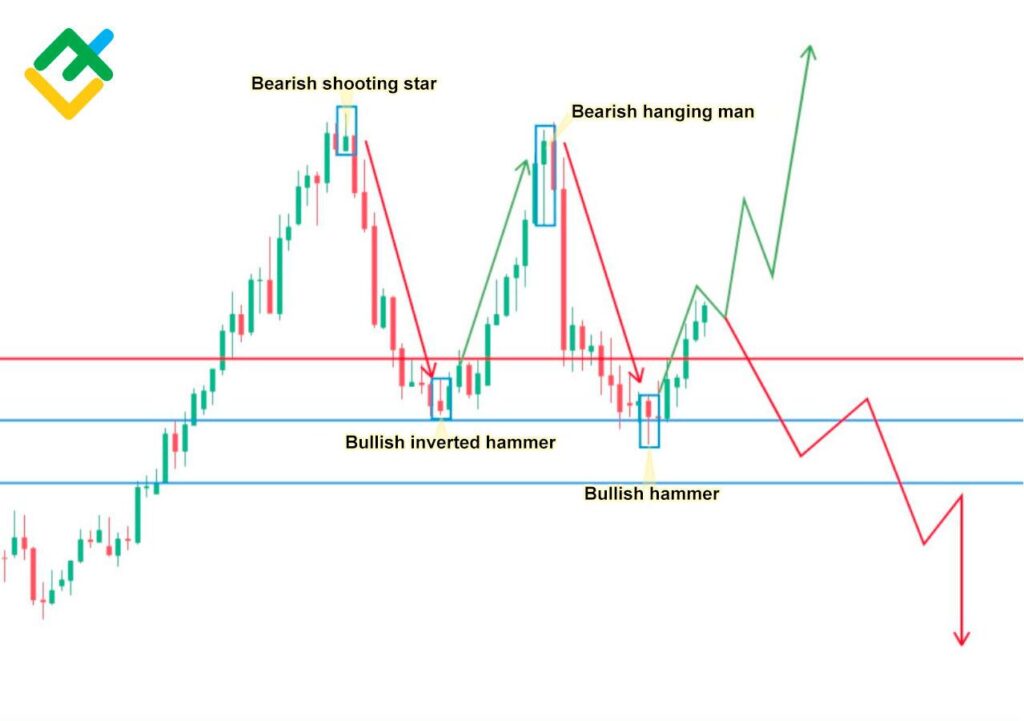
It’s important to differentiate the red hammer candlestick from other similar patterns, such as the hanging man and the inverted hammer.
- Hanging Man: The hanging man pattern looks identical to the hammer but forms after an uptrend, signaling a potential bearish reversal. The hammer forms after a downtrend and signals a potential bullish reversal.
- Inverted Hammer: The inverted hammer has a small body and a long upper wick, with little or no lower wick. It also forms after a downtrend and signals a potential bullish reversal. However, the inverted hammer suggests that buyers initially pushed the price up, but sellers then brought it back down, creating the long upper wick.
Incorporating the Red Hammer Candlestick into Your Trading Strategy
The red hammer candlestick can be a valuable addition to your trading strategy. Here are some tips for incorporating it effectively:
- Use it as Part of a Broader Analysis: Don’t rely solely on the hammer pattern. Combine it with other technical indicators, chart patterns, and fundamental analysis to make informed trading decisions.
- Set Stop-Loss Orders: Always set stop-loss orders to limit your potential losses if the pattern fails. A common stop-loss placement is below the low of the hammer.
- Manage Your Risk: Only risk a small percentage of your trading capital on any single trade. This will help you protect your capital and avoid significant losses.
- Practice and Refine Your Strategy: Practice identifying and trading the hammer pattern in a demo account before risking real money. Refine your strategy based on your experience and results.
The red hammer candlestick pattern is a valuable tool for identifying potential bullish reversals in the market. By understanding its formation, interpretation, confirmation, and limitations, traders can improve their decision-making and increase their chances of success. Remember to always confirm the pattern with other indicators and analysis techniques, and to manage your risk effectively. Happy trading! [See also: Understanding Candlestick Charts] [See also: Bullish Reversal Patterns] [See also: Technical Analysis for Beginners]
