Decoding the Red Hammer Candlestick: A Comprehensive Guide for Traders
The financial markets are a complex arena, and mastering them requires a deep understanding of various analytical tools. Among these tools, candlestick patterns stand out as a crucial component of technical analysis. One such pattern, the red hammer candlestick, offers valuable insights into potential market reversals. This comprehensive guide aims to dissect the red hammer candlestick pattern, providing traders with the knowledge to identify, interpret, and utilize it effectively in their trading strategies.
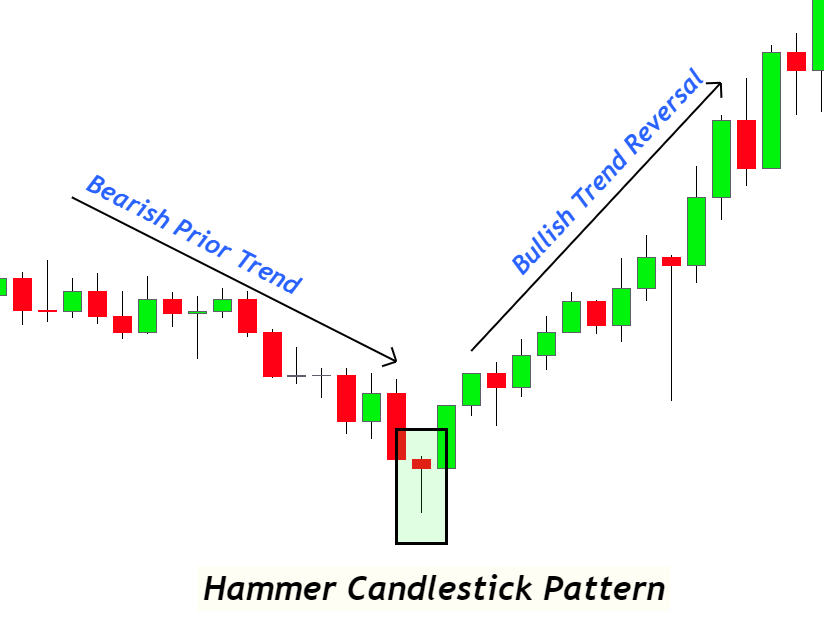
What is a Hammer Candlestick?
Before diving into the specifics of the red hammer candlestick, it’s essential to understand the broader concept of a hammer candlestick. The hammer is a bullish reversal pattern that typically forms after a downtrend. It’s characterized by a small body, a long lower shadow (or wick), and a short or nonexistent upper shadow. The long lower shadow indicates that sellers initially pushed the price lower, but buyers stepped in and drove the price back up, suggesting a potential shift in market sentiment.
Key Characteristics of a Hammer Candlestick:
- Small Body: The real body (the difference between the open and close price) is relatively small.
- Long Lower Shadow: The lower shadow should be at least twice the length of the body.
- Short or Nonexistent Upper Shadow: Ideally, there should be little to no upper shadow.
- Prior Downtrend: The hammer should form after a period of declining prices.
The Red Hammer Candlestick: Nuances and Interpretation
The red hammer candlestick is simply a hammer candlestick where the body is red (or black, depending on the charting platform). This means that the closing price is lower than the opening price for that particular trading period. While the color of the body might seem insignificant, it can offer additional clues about the strength of the reversal. A red hammer candlestick suggests that although buyers were able to push the price up from the lows, they weren’t strong enough to close the price above the opening price. This can indicate a slightly weaker reversal signal compared to a green hammer.
Interpreting the Red Hammer:
Despite the red body, the red hammer candlestick still signals a potential bullish reversal. The long lower shadow signifies strong buying pressure that overcame the initial selling pressure. However, it’s crucial to consider the context in which the pattern appears. The stronger the preceding downtrend, the more significant the potential reversal signal. Traders should also look for confirmation in subsequent trading periods, such as a bullish candle following the red hammer candlestick.
Identifying the Red Hammer Candlestick on a Chart
Identifying the red hammer candlestick requires careful observation and practice. Here’s a step-by-step guide:
- Identify a Downtrend: Look for a period where the price has been consistently declining.
- Look for the Candlestick Shape: Search for a candlestick with a small body, a long lower shadow (at least twice the length of the body), and a short or nonexistent upper shadow. The body should be red.
- Consider the Context: Evaluate the surrounding price action. Is the hammer appearing at a support level? Is it accompanied by other bullish signals?
Remember, no single candlestick pattern is foolproof. It’s essential to use the red hammer candlestick in conjunction with other technical indicators and analysis techniques.
Confirmation and Trading Strategies
Confirmation is key when trading based on the red hammer candlestick. Waiting for confirmation helps to reduce the risk of false signals and increase the probability of a successful trade. Here are some common confirmation methods:
- Bullish Candle Confirmation: Look for a bullish (green) candle that closes above the high of the red hammer candlestick. This indicates that buyers are indeed in control.
- Volume Confirmation: Higher-than-average volume during the formation of the hammer and the subsequent bullish candle can add further conviction to the signal.
- Indicator Confirmation: Use other technical indicators, such as the Relative Strength Index (RSI) or Moving Average Convergence Divergence (MACD), to confirm the bullish reversal. For example, if the RSI is oversold and the red hammer candlestick forms, it could strengthen the reversal signal.
Trading Strategies:
Once confirmation is established, traders can implement various strategies:
- Long Entry: Enter a long position after the confirming bullish candle closes above the high of the red hammer candlestick.
- Stop-Loss Placement: Place a stop-loss order below the low of the red hammer candlestick to limit potential losses if the reversal fails.
- Profit Target: Set a profit target based on previous resistance levels or using techniques like Fibonacci extensions.
Red Hammer Candlestick vs. Other Candlestick Patterns
It’s crucial to differentiate the red hammer candlestick from other similar candlestick patterns to avoid confusion. Here’s a comparison with some common patterns:
- Hammer vs. Hanging Man: The hanging man looks identical to the hammer but appears after an uptrend. It’s a bearish reversal signal, whereas the hammer is bullish. The context is critical.
- Hammer vs. Inverted Hammer: The inverted hammer has a long upper shadow and a small lower shadow. It also appears after a downtrend and signals a potential bullish reversal, but the implications are slightly different. The inverted hammer suggests that buyers tried to push the price higher, but sellers ultimately resisted.
- Hammer vs. Doji: A doji has a very small body, indicating indecision in the market. While it can sometimes precede a reversal, it’s not as strong a signal as the hammer.
The Psychology Behind the Red Hammer Candlestick
Understanding the psychology behind the red hammer candlestick can provide a deeper appreciation for its significance. The pattern reflects a battle between buyers and sellers. During the trading period, sellers initially dominate, pushing the price down to new lows. However, buyers then step in aggressively, driving the price back up towards the opening price. While the closing price ends up being slightly lower than the opening (hence the red body), the significant buying pressure demonstrates a potential shift in sentiment. This shift can be attributed to various factors, such as bargain hunters entering the market or short-sellers covering their positions.
Limitations of the Red Hammer Candlestick
While the red hammer candlestick can be a valuable tool, it’s important to acknowledge its limitations:
- False Signals: Like all technical indicators, the red hammer candlestick can generate false signals. It’s crucial to wait for confirmation before entering a trade.
- Market Context: The effectiveness of the pattern depends on the overall market context. A red hammer candlestick forming in a weak or range-bound market may not be as reliable.
- Subjectivity: Identifying the pattern can be subjective, especially when determining the length of the lower shadow and the size of the body.
Real-World Examples of Red Hammer Candlestick Patterns
To illustrate the practical application of the red hammer candlestick, let’s consider a few hypothetical examples:
Example 1: Imagine a stock has been in a downtrend for several weeks. Suddenly, a red hammer candlestick forms near a known support level. The next day, a strong bullish candle confirms the reversal. A trader might enter a long position at the close of the confirming candle, placing a stop-loss below the low of the hammer.
Example 2: Consider a currency pair that has been declining steadily. A red hammer candlestick appears, but the volume is relatively low. The trader decides to wait for further confirmation. The following day, the price gaps up and closes significantly higher, accompanied by high volume. This provides stronger confirmation, and the trader enters a long position.
Advanced Techniques with the Red Hammer
Experienced traders often combine the red hammer candlestick with other advanced techniques to enhance their trading strategies. These techniques include:
- Fibonacci Retracement: Look for red hammer candlestick patterns that form at key Fibonacci retracement levels. This can provide confluence and increase the probability of a successful trade.
- Moving Averages: Identify red hammer candlestick patterns that form near a long-term moving average. This can act as a dynamic support level and strengthen the reversal signal.
- Elliott Wave Theory: Use the red hammer candlestick to identify potential wave reversals within an Elliott Wave sequence.
Conclusion
The red hammer candlestick is a valuable tool for traders seeking to identify potential bullish reversals. By understanding its characteristics, interpreting its signals, and using it in conjunction with other technical indicators, traders can improve their trading accuracy and increase their profitability. Remember to always wait for confirmation, consider the market context, and manage your risk effectively. The red hammer candlestick, when used correctly, can be a powerful addition to any trader’s arsenal. [See also: Understanding Candlestick Patterns] and [See also: Technical Analysis for Beginners]
