Decoding the Red Hammer Candlestick Pattern: A Comprehensive Guide
The financial markets are a complex landscape, and understanding the nuances of trading tools can significantly enhance investment strategies. Among these tools, candlestick patterns hold a prominent position. This article delves into the specifics of one such pattern: the red hammer candlestick. We will explore its characteristics, how it differs from other patterns, its implications for market trends, and how traders can effectively use it to make informed decisions. Understanding the red hammer candlestick can be a pivotal skill for any serious trader.
What is a Hammer Candlestick?
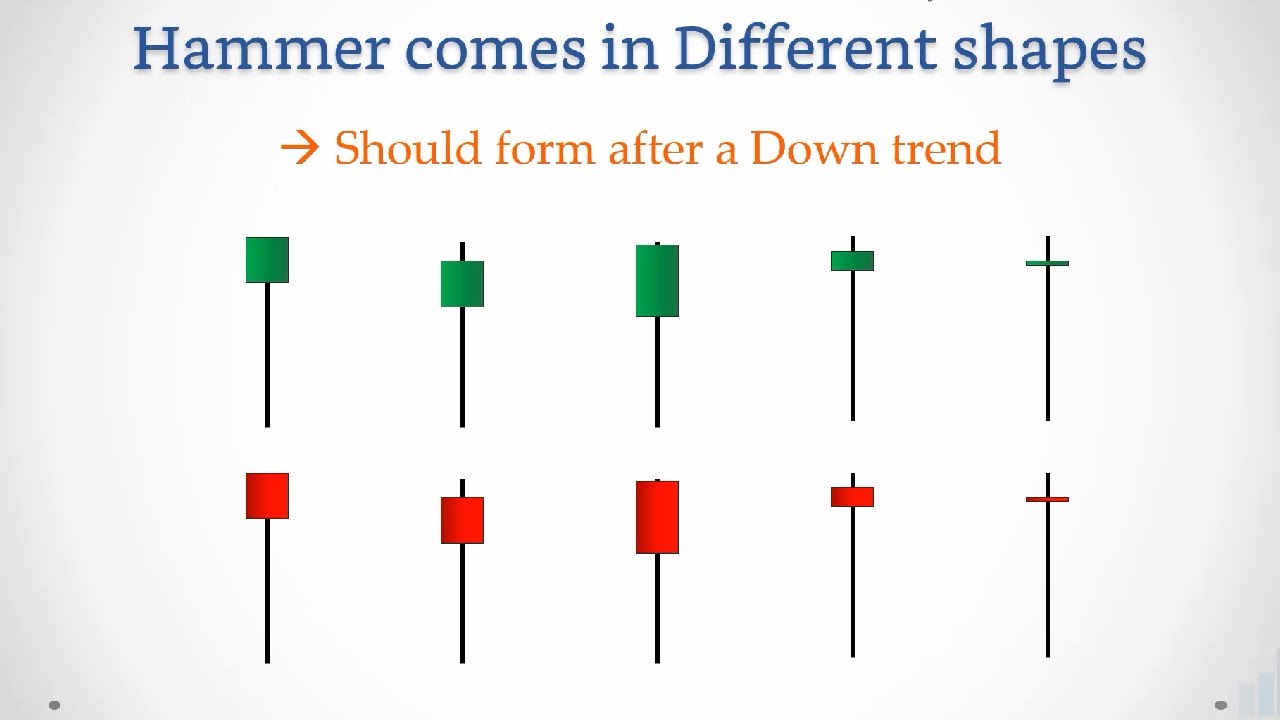
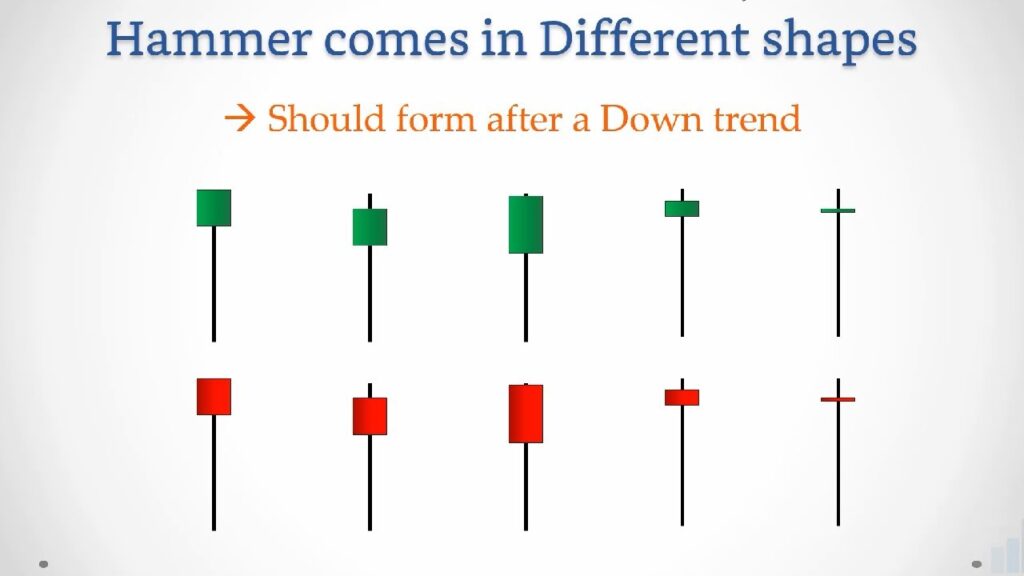
Before focusing on the red hammer candlestick, it’s crucial to understand the general concept of a hammer candlestick. A hammer is a bullish reversal pattern that forms after a downtrend. It signals that a stock or asset might be nearing the end of its downward trajectory and could be poised for an upward move. This pattern is characterized by a small body near the top of the candlestick and a long lower shadow, typically at least twice the length of the body. The upper shadow, if present, is usually very short or non-existent. This shape resembles a hammer, hence the name.
Characteristics of the Red Hammer Candlestick
The red hammer candlestick is a variation of the standard hammer pattern. The primary difference lies in the color of the body. A standard hammer can be either green (indicating a bullish close) or red (indicating a bearish close). In the case of the red hammer candlestick, the body is red, meaning the closing price was lower than the opening price for that period. Despite the bearish color, the red hammer candlestick still carries bullish implications when it appears after a downtrend.
- Small Real Body: The body of the candlestick, whether green or red, is relatively small compared to the overall length of the candlestick.
- Long Lower Shadow: The lower shadow is a critical component. It signifies that during the trading period, the price went significantly lower but rebounded to close near the opening price.
- Little or No Upper Shadow: Ideally, there should be little to no upper shadow. A significant upper shadow could weaken the bullish signal.
- Appearance After a Downtrend: The hammer pattern is only valid when it appears after a sustained downtrend. It indicates a potential reversal of the downward momentum.
The Psychology Behind the Red Hammer Candlestick
Understanding the psychology behind the red hammer candlestick is essential for interpreting its meaning. During the downtrend, sellers are in control, driving the price lower. When the red hammer candlestick forms, it indicates that the bears initially pushed the price down significantly during the trading period. However, buyers stepped in and aggressively bought the asset, pushing the price back up to close near the opening price. The long lower shadow represents this battle between buyers and sellers, with the buyers ultimately gaining ground. Even though the candle is red, the strong buying pressure suggests a potential shift in momentum from bearish to bullish. This shift can signal a buying opportunity for traders.
Red Hammer vs. Green Hammer: What’s the Difference?
While both the red hammer candlestick and the green hammer candlestick share the same basic shape and bullish implications, the color of the body provides slightly different insights. The green hammer closes higher than it opens, indicating a stronger bullish sentiment within that period. The red hammer candlestick, closing lower than it opens, suggests that while buyers did step in, they weren’t strong enough to push the price above the opening level. However, both patterns still indicate a potential bullish reversal after a downtrend. Many traders consider the green hammer to be a slightly stronger signal, but the red hammer candlestick should not be dismissed, especially when confirmed by other technical indicators.
How to Identify a Red Hammer Candlestick on a Chart
Identifying a red hammer candlestick on a chart requires careful observation. Here’s a step-by-step guide:
- Identify a Downtrend: The first step is to identify a clear downtrend in the market. The hammer pattern is only significant if it appears after a period of declining prices.
- Look for the Candlestick Shape: Look for a candlestick with a small real body (red in this case), a long lower shadow (at least twice the length of the body), and little to no upper shadow.
- Confirm the Downtrend: Ensure the candlestick is indeed part of a downtrend. A single down candle is not enough; there should be a series of lower highs and lower lows.
- Consider Volume: Higher volume during the formation of the red hammer candlestick can add more validity to the pattern. Increased volume suggests stronger buying pressure.
Trading Strategies Using the Red Hammer Candlestick
Once you’ve identified a red hammer candlestick, you can incorporate it into your trading strategy. Here are a few common approaches:
Confirmation
It’s crucial to seek confirmation before acting solely on the red hammer candlestick. Confirmation can come in several forms:
- Bullish Candlestick the Following Day: If the candlestick immediately following the red hammer candlestick is a bullish candlestick (green), it provides further confirmation of the reversal.
- Break Above the Hammer’s High: A break above the high of the red hammer candlestick is another strong confirmation signal. This indicates that buyers are indeed taking control.
- Technical Indicators: Use other technical indicators like the Relative Strength Index (RSI), Moving Average Convergence Divergence (MACD), or Fibonacci retracement levels to confirm the bullish signal.
Setting Stop-Loss Orders
Proper risk management is essential when trading any candlestick pattern. A common strategy is to place a stop-loss order slightly below the low of the red hammer candlestick. This limits potential losses if the pattern fails and the price continues to decline.
Setting Profit Targets
Setting realistic profit targets is equally important. Traders often use Fibonacci extension levels or previous resistance levels to determine potential profit targets. Another approach is to use a risk-reward ratio, aiming for a profit that is at least twice the risk taken (i.e., the distance between the entry point and the stop-loss order).
Combining with Other Patterns
The red hammer candlestick can be combined with other candlestick patterns or technical analysis techniques to increase the probability of a successful trade. For example, if a red hammer candlestick appears near a key support level and is followed by a bullish engulfing pattern, the combined signals provide a stronger indication of a potential reversal. [See also: Understanding Bullish Engulfing Patterns]
Examples of the Red Hammer Candlestick in Action
To illustrate the practical application of the red hammer candlestick, let’s consider a few hypothetical examples:
Example 1: Imagine a stock has been in a downtrend for several weeks. On a particular day, a red hammer candlestick forms. The long lower shadow indicates that buyers stepped in to support the price. If the following day, the stock opens higher and continues to climb, breaking above the high of the red hammer candlestick, it provides a strong confirmation signal. A trader might enter a long position with a stop-loss order placed below the low of the hammer.
Example 2: Consider a cryptocurrency that has been declining. A red hammer candlestick appears on the daily chart near a key Fibonacci retracement level. The RSI is also showing oversold conditions. This confluence of factors suggests a high probability of a bullish reversal. A trader might enter a long position, using the Fibonacci level as a potential profit target and the low of the hammer as a stop-loss level. [See also: Fibonacci Retracement Strategies for Crypto Trading]
Limitations of the Red Hammer Candlestick
While the red hammer candlestick can be a valuable tool, it’s important to acknowledge its limitations:
- False Signals: Like any technical indicator, the red hammer candlestick can produce false signals. Not every hammer pattern will result in a bullish reversal.
- Market Context: The effectiveness of the red hammer candlestick can be influenced by the overall market context. In a strong bear market, even seemingly bullish patterns may fail.
- Timeframe Dependency: The significance of the red hammer candlestick can vary depending on the timeframe. A hammer pattern on a daily chart might be more reliable than one on a 5-minute chart.
Best Practices for Trading with the Red Hammer Candlestick
To maximize the effectiveness of the red hammer candlestick in your trading strategy, consider these best practices:
- Always Seek Confirmation: As emphasized earlier, confirmation is key. Don’t rely solely on the hammer pattern without validating it with other indicators or price action.
- Use Proper Risk Management: Implement stop-loss orders to protect your capital. Never risk more than you can afford to lose on a single trade.
- Consider the Broader Market Context: Analyze the overall market trends and economic conditions. A bullish pattern in a bearish market might be less reliable.
- Backtest Your Strategies: Before deploying a trading strategy with real money, backtest it using historical data to assess its performance and identify potential weaknesses.
- Stay Informed: Continuously educate yourself about technical analysis and market dynamics. The more you understand the markets, the better equipped you will be to interpret candlestick patterns and make informed trading decisions.
Conclusion
The red hammer candlestick is a valuable tool for traders looking to identify potential bullish reversals after a downtrend. Understanding its characteristics, the psychology behind it, and how to confirm its signals can significantly enhance your trading strategies. However, it’s crucial to remember that no single indicator is foolproof. Always combine the red hammer candlestick with other technical analysis techniques, practice proper risk management, and stay informed about the broader market context to increase your chances of success. By incorporating this pattern into a well-rounded trading approach, you can navigate the financial markets with greater confidence and potentially improve your investment outcomes. Remember to always trade responsibly and consult with a financial advisor if needed. Mastering the identification and interpretation of the red hammer candlestick is a step towards becoming a more informed and successful trader.
