Decoding the Stock Candlestick Hammer: A Comprehensive Guide
In the realm of stock trading, candlestick patterns serve as visual representations of price movements, offering traders insights into potential market trends. Among these patterns, the stock candlestick hammer stands out as a significant bullish reversal signal. This guide provides a comprehensive overview of the hammer pattern, its characteristics, interpretation, and practical application in trading strategies. Understanding the nuances of the stock candlestick hammer can empower traders to make more informed decisions and potentially improve their trading outcomes.
What is a Stock Candlestick Hammer?
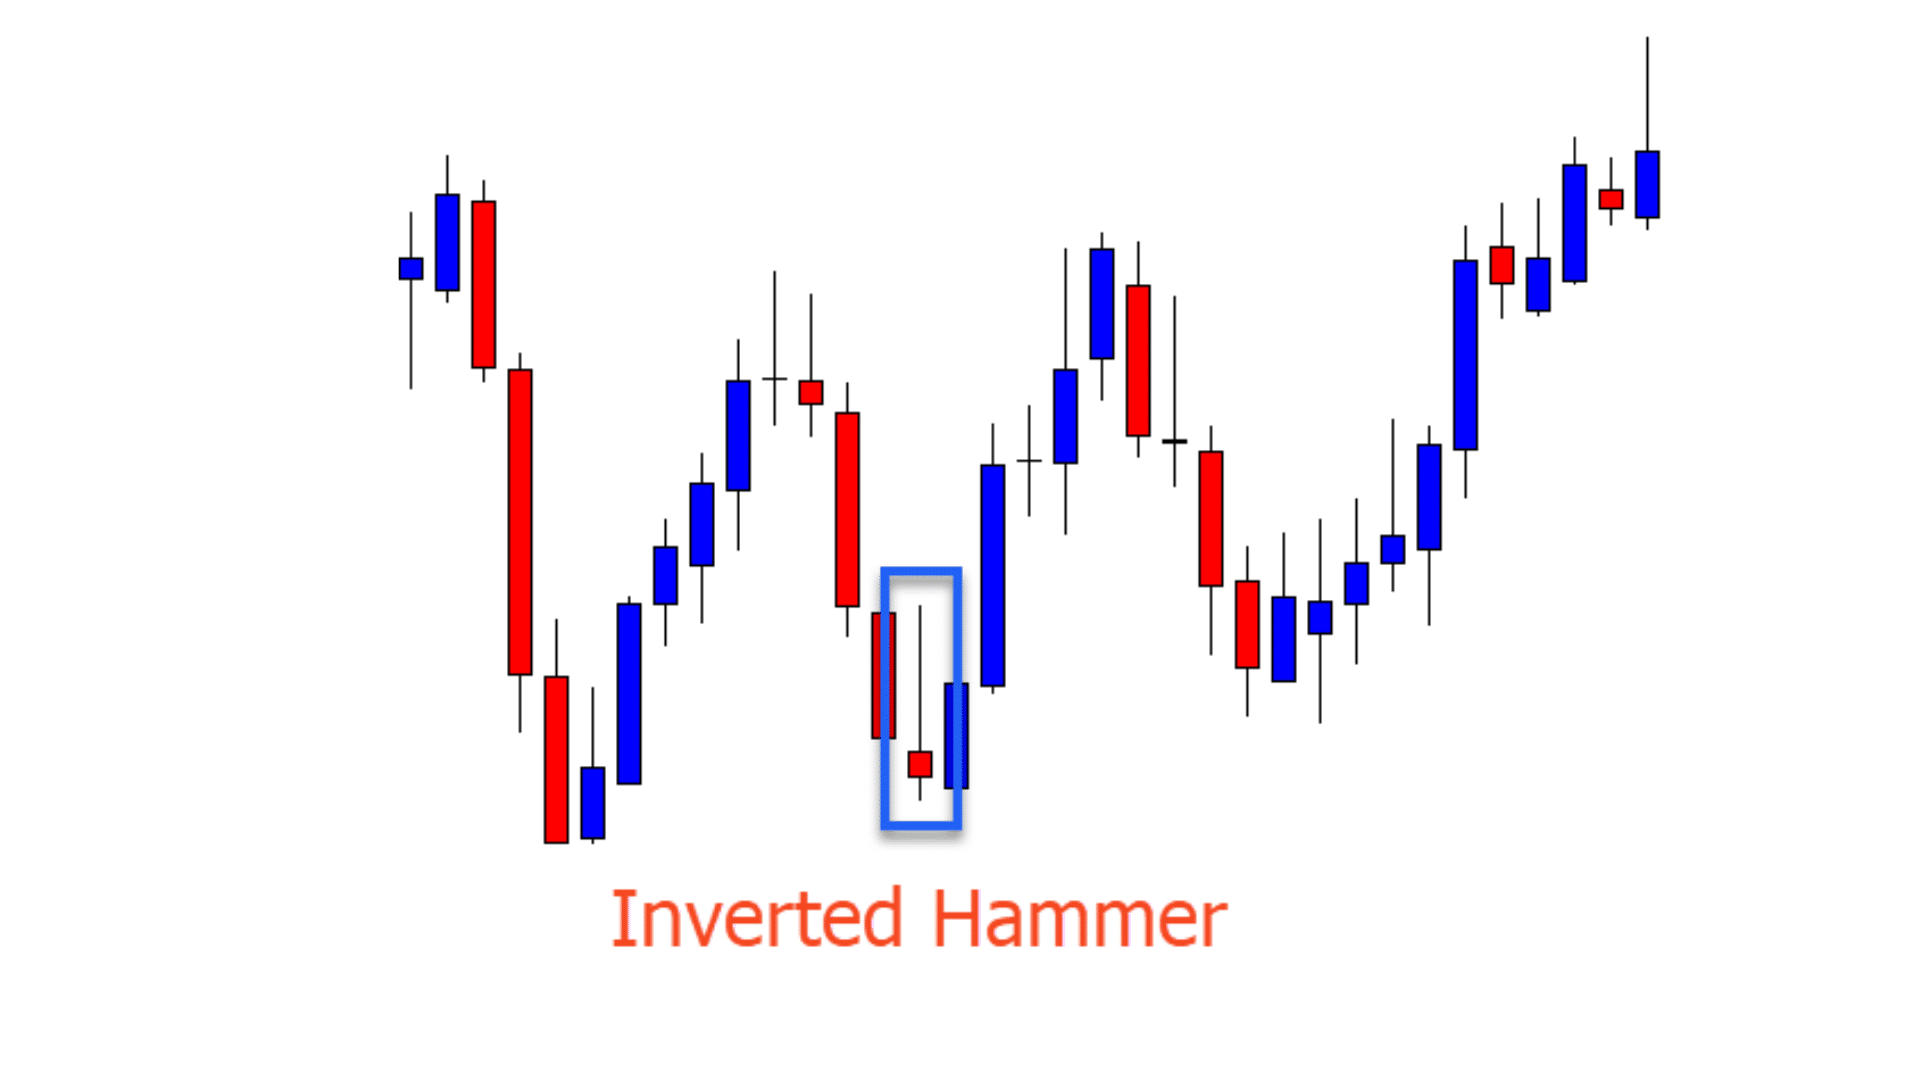
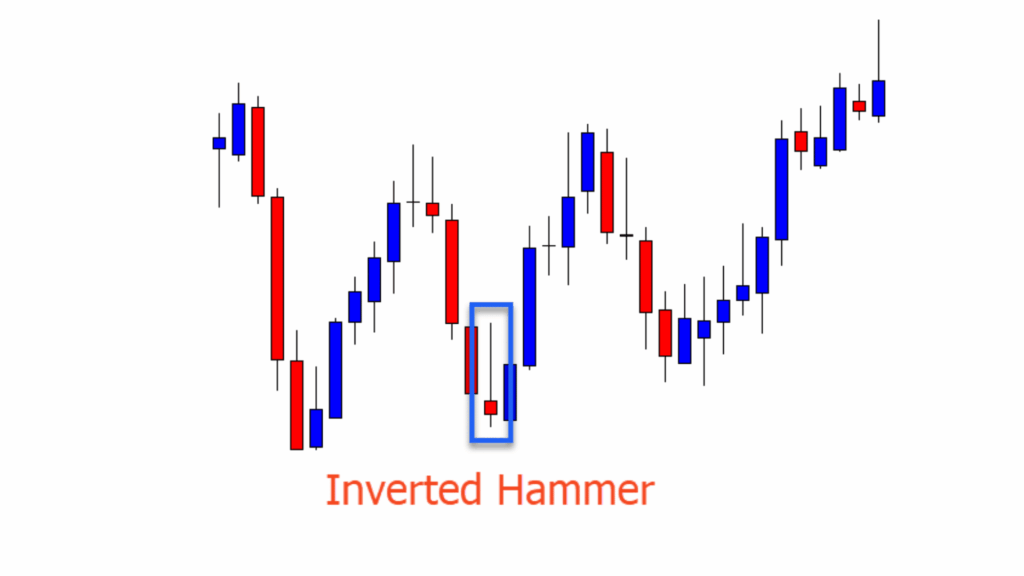
A stock candlestick hammer is a single candlestick pattern that appears primarily in downtrends and signals a potential bullish reversal. It’s characterized by a small body, a long lower shadow (or wick), and little or no upper shadow. The length of the lower shadow should be at least twice the length of the body. The color of the body (whether bullish white/green or bearish black/red) is not as important as the shape of the candlestick itself. The key is the long lower shadow indicating that sellers initially pushed the price lower, but buyers stepped in to drive the price back up, suggesting a potential shift in momentum.
Key Characteristics of a Hammer Candlestick
- Small Body: The real body (the difference between the open and close price) is relatively small.
- Long Lower Shadow: The lower shadow is significantly longer than the body, typically at least twice its size.
- Little or No Upper Shadow: Ideally, there should be little to no upper shadow. A small upper shadow is acceptable, but a long one diminishes the pattern’s reliability.
- Appears in a Downtrend: The hammer is most effective when it appears after a period of declining prices.
Interpreting the Stock Candlestick Hammer
The stock candlestick hammer pattern suggests that despite selling pressure during the period, buyers managed to regain control and push the price back up near the opening price. This indicates a potential weakening of the downtrend and the possibility of a bullish reversal. The long lower shadow represents the extent of the selling pressure, while the small body reflects the buyers’ ability to counteract that pressure.
Psychology Behind the Hammer Pattern
The hammer reflects a battle between buyers and sellers. Sellers initially dominate, pushing the price significantly lower. However, buyers then intervene, driving the price back up, often near the opening price. This suggests a shift in sentiment, with buyers gaining strength and potentially reversing the downtrend. The longer the lower shadow, the more significant the potential reversal signal.
Confirmation is Key
While the stock candlestick hammer is a valuable indicator, it’s crucial to seek confirmation before acting on it. Confirmation typically comes in the form of a bullish candlestick on the following day, closing above the high of the hammer. This confirms that the buyers have indeed taken control and are continuing to push the price higher. Without confirmation, the hammer could be a false signal, leading to potential losses. [See also: Understanding Candlestick Patterns]
Methods of Confirmation
- Bullish Candlestick: The most common form of confirmation is a bullish candlestick (white/green) on the following day, closing above the high of the hammer.
- Increased Volume: Increased trading volume on the day of the hammer or the confirmation day can further strengthen the signal.
- Other Technical Indicators: Combining the hammer pattern with other technical indicators, such as moving averages or the Relative Strength Index (RSI), can provide additional confirmation.
Trading Strategies Using the Stock Candlestick Hammer
The stock candlestick hammer can be incorporated into various trading strategies. Here are a few examples:
Entry Points
Traders often look to enter a long position after confirmation of the hammer pattern. This could involve placing a buy order above the high of the hammer, anticipating further price increases. A more conservative approach is to wait for the price to close above the high of the hammer before entering a position.
Stop-Loss Orders
A stop-loss order is essential for managing risk when trading the hammer pattern. A common placement for a stop-loss is below the low of the hammer. This limits potential losses if the price fails to rise as expected and instead continues to decline. The placement of the stop-loss should also consider the trader’s risk tolerance and the volatility of the stock.
Profit Targets
Setting profit targets is crucial for capturing gains. Profit targets can be determined using various methods, such as Fibonacci extensions, resistance levels, or previous swing highs. A common approach is to set a target based on a multiple of the risk, for example, aiming for a 2:1 or 3:1 risk-reward ratio. [See also: Risk Management in Stock Trading]
Examples of Stock Candlestick Hammer in Action
Let’s consider a hypothetical example. Imagine a stock has been declining for several weeks. One day, a candlestick forms with a small body, a long lower shadow, and little to no upper shadow – a textbook stock candlestick hammer. The next day, a bullish candlestick appears, closing above the high of the hammer. This confirms the bullish reversal signal. A trader might enter a long position at this point, placing a stop-loss below the low of the hammer and setting a profit target based on previous resistance levels.
Real-World Examples
Analyzing historical stock charts can reveal numerous examples of the hammer pattern. Identifying these patterns and understanding their subsequent price action can provide valuable insights into their effectiveness and limitations. Remember to always consider the broader market context and other technical indicators when evaluating the hammer pattern.
Limitations of the Stock Candlestick Hammer
While the stock candlestick hammer is a useful tool, it’s important to acknowledge its limitations. The pattern is not always reliable, and false signals can occur. Factors such as market volatility, overall market trends, and news events can influence the pattern’s effectiveness. Relying solely on the hammer pattern without considering other factors can lead to poor trading decisions. [See also: Technical Analysis for Beginners]
Potential Pitfalls
- False Signals: The hammer pattern can sometimes generate false signals, especially in volatile market conditions.
- Lack of Confirmation: Trading the hammer pattern without confirmation can increase the risk of losses.
- Ignoring Market Context: Failing to consider the broader market context and other technical indicators can lead to misinterpretations.
Hammer vs. Hanging Man
It’s crucial to differentiate the stock candlestick hammer from the hanging man pattern. While they have the same shape, their significance differs based on their location within a trend. The hammer appears in a downtrend and signals a potential bullish reversal, while the hanging man appears in an uptrend and signals a potential bearish reversal. Confusing these patterns can lead to incorrect trading decisions.
Key Differences
- Location: Hammer appears in a downtrend; Hanging Man appears in an uptrend.
- Significance: Hammer signals a bullish reversal; Hanging Man signals a bearish reversal.
Conclusion
The stock candlestick hammer is a valuable tool for identifying potential bullish reversals in downtrends. By understanding its characteristics, interpretation, and limitations, traders can incorporate this pattern into their trading strategies. However, it’s crucial to remember that confirmation is key, and the hammer should be used in conjunction with other technical indicators and a thorough understanding of market context. By combining these elements, traders can increase their chances of making informed and profitable trading decisions using the stock candlestick hammer pattern. The stock candlestick hammer pattern offers a visual cue into potential market shifts, but always prioritize comprehensive analysis and risk management.
