Decoding the Stock Hammer Candle: A Comprehensive Guide
In the dynamic world of stock trading, understanding candlestick patterns is crucial for making informed decisions. One such pattern, the stock hammer candle, can signal potential bullish reversals, offering traders valuable insights into market sentiment. This guide delves into the intricacies of the hammer candle, exploring its formation, interpretation, and application in various trading strategies. Whether you’re a seasoned investor or a novice trader, mastering the hammer candle can significantly enhance your trading acumen.
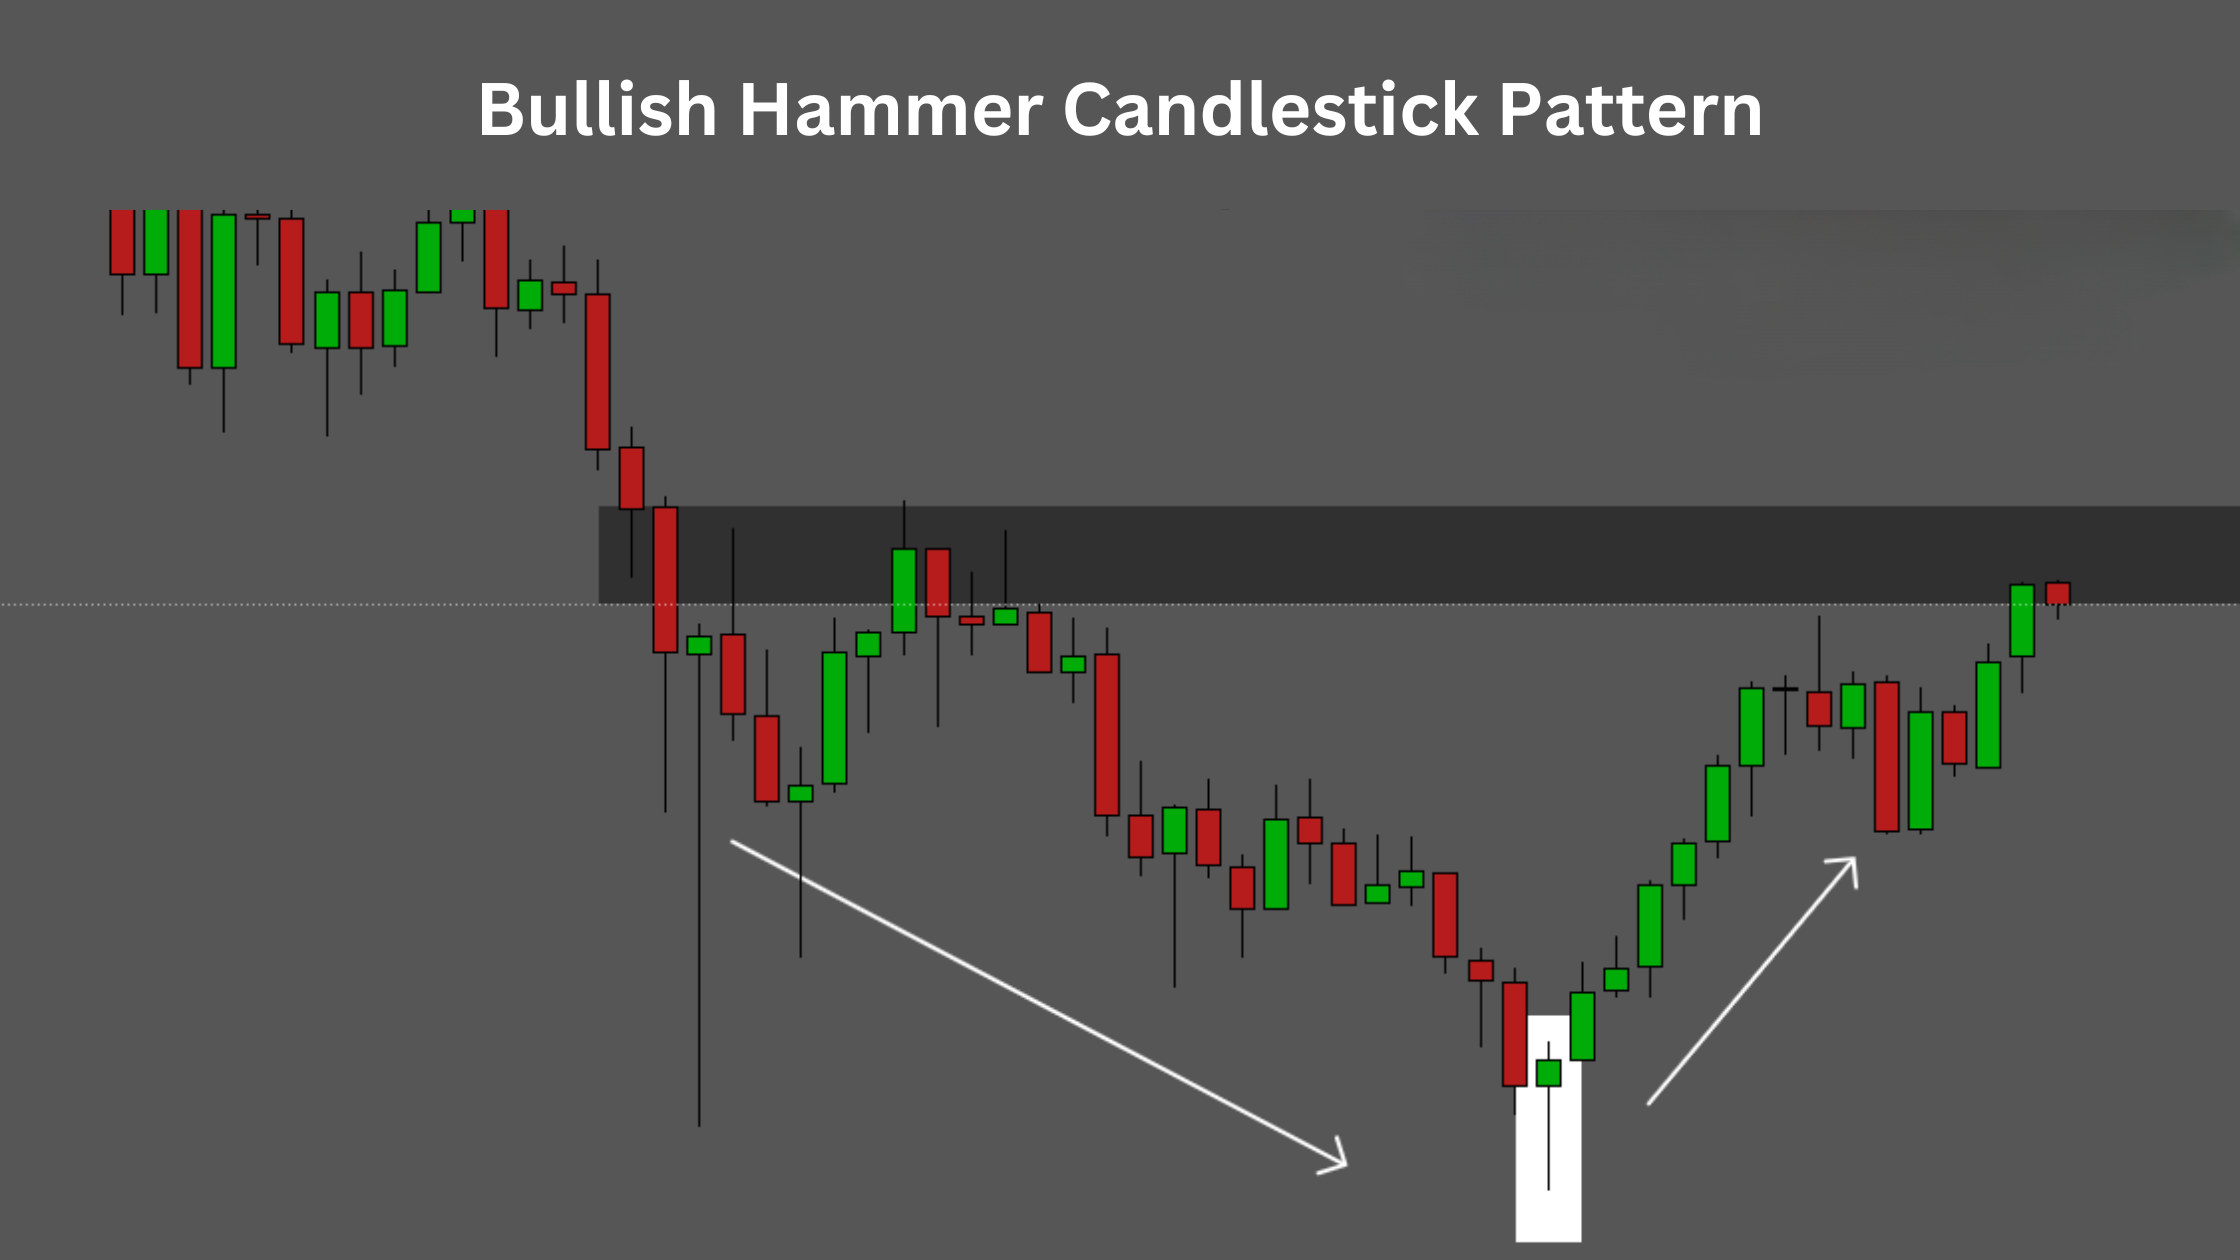
What is a Stock Hammer Candle?
The stock hammer candle is a single-candlestick pattern that appears on a price chart, indicating a potential bottom reversal in a downtrend. It’s characterized by a small body, a long lower shadow (or wick), and a short or absent upper shadow. The long lower shadow suggests that sellers initially drove the price lower during the trading period, but buyers then stepped in and pushed the price back up, closing near the opening price. This buying pressure can signal a shift in momentum and a potential upward trend.
Key Characteristics of a Hammer Candle
- Small Body: The real body (the difference between the open and close price) is relatively small.
- Long Lower Shadow: The lower shadow is at least twice the length of the real body.
- Short or Absent Upper Shadow: Ideally, there should be little to no upper shadow.
- Downtrend Precedence: The hammer candle is only valid if it appears after a downtrend.
How to Identify a Stock Hammer Candle
Identifying a stock hammer candle requires careful observation of price charts. Look for a candle that fits the characteristics mentioned above, specifically after a sustained downtrend. The color of the body (whether it’s bullish or bearish) is less important than the overall shape and placement of the candle. However, a bullish hammer (where the closing price is higher than the opening price) can add further confirmation to the potential reversal signal.
Confirmation is Key
While the hammer candle can be a powerful indicator, it’s essential to seek confirmation before making any trading decisions. Confirmation typically comes in the form of a bullish candle following the hammer, indicating that buyers are indeed taking control. Volume can also play a role in confirmation; higher volume on the hammer candle and the subsequent bullish candle strengthens the signal.
Interpreting the Stock Hammer Candle
The interpretation of a stock hammer candle hinges on understanding the underlying market dynamics. The long lower shadow signifies a test of lower price levels, which was ultimately rejected by buyers. This rejection suggests that the downtrend may be losing steam and that buyers are willing to step in and support the price. However, it’s crucial to remember that the hammer candle is just one piece of the puzzle and should be used in conjunction with other technical indicators and analysis techniques.
Considering Market Context
The effectiveness of the stock hammer candle can vary depending on the broader market context. Factors such as overall market sentiment, economic news, and company-specific developments can influence the strength of the signal. For example, a hammer candle appearing during a period of positive economic news may be a stronger indicator of a bullish reversal than one appearing during a period of uncertainty.
Trading Strategies Using the Stock Hammer Candle
Several trading strategies can be employed using the stock hammer candle as a signal. Here are a few common approaches:
Long Entry After Confirmation
One of the most conservative strategies is to wait for confirmation before entering a long position. This involves waiting for a bullish candle to close above the high of the hammer candle. This confirms that buyers have indeed taken control and that the upward trend is likely to continue. A stop-loss order can be placed below the low of the hammer candle to manage risk.
Aggressive Entry at the Hammer’s Close
More aggressive traders may choose to enter a long position at the close of the hammer candle, anticipating that the bullish reversal will continue. This approach carries higher risk, as there is no confirmation that the trend will actually reverse. A tighter stop-loss order is typically used to mitigate this risk.
Combining with Other Indicators
The stock hammer candle can be used in conjunction with other technical indicators to improve the accuracy of trading signals. For example, combining the hammer with a moving average crossover or an oversold reading on the Relative Strength Index (RSI) can provide a more robust confirmation of a potential bullish reversal. [See also: RSI Trading Strategies]
Examples of Stock Hammer Candles in Action
Let’s examine a few hypothetical examples to illustrate how the stock hammer candle might appear in real-world trading scenarios:
Example 1: Reversal After Downtrend
Imagine a stock has been in a consistent downtrend for several weeks. Suddenly, a stock hammer candle appears on the chart. The long lower shadow indicates that buyers stepped in and pushed the price back up, closing near the opening price. The following day, a strong bullish candle closes above the high of the hammer, confirming the reversal. A trader could enter a long position at this point, with a stop-loss order placed below the low of the hammer.
Example 2: False Signal
In another scenario, a stock hammer candle appears after a downtrend, but the subsequent candle is bearish. This indicates that the hammer signal was a false alarm and that the downtrend is likely to continue. A trader who entered a long position based solely on the hammer would likely incur a loss. This highlights the importance of seeking confirmation and using stop-loss orders.
Limitations of the Stock Hammer Candle
While the stock hammer candle can be a valuable tool for traders, it’s important to be aware of its limitations:
- False Signals: As demonstrated in the example above, hammer candles can sometimes generate false signals, leading to losing trades.
- Subjectivity: The interpretation of candlestick patterns can be subjective, and different traders may draw different conclusions from the same chart.
- Market Volatility: The effectiveness of the hammer candle can be affected by market volatility. In highly volatile markets, candlestick patterns may be less reliable.
- Requires Confirmation: Always wait for confirmation before acting on a hammer signal. Do not rely solely on one candlestick pattern.
The Inverted Hammer: A Close Relative
The inverted hammer is another single candlestick pattern that, like the stock hammer candle, can signal a potential bullish reversal. However, the inverted hammer has a long upper shadow and a short lower shadow (or none at all). It appears at the bottom of a downtrend and suggests that buyers are starting to exert upward pressure on the price. [See also: Understanding Candlestick Patterns]
Conclusion: Mastering the Stock Hammer Candle
The stock hammer candle is a powerful tool for identifying potential bullish reversals in the stock market. By understanding its formation, interpretation, and limitations, traders can enhance their trading strategies and make more informed decisions. Remember to always seek confirmation, consider the broader market context, and use stop-loss orders to manage risk. Mastering the stock hammer candle is a valuable step towards becoming a more successful and confident trader. The stock hammer candle, when used correctly, can provide valuable insight into market sentiment and potential future price movements. Learning to identify and interpret the stock hammer candle is a crucial skill for any serious trader. Keep practicing and refining your skills to unlock the full potential of this powerful candlestick pattern. Don’t forget that the stock hammer candle works best when combined with other technical indicators and a sound risk management strategy.
