Decoding the Stocks Hammer Candlestick: A Comprehensive Guide
In the dynamic world of stock trading, understanding candlestick patterns is crucial for making informed decisions. Among these patterns, the stocks hammer candlestick stands out as a significant signal of potential bullish reversals. This article will delve into the intricacies of the hammer candlestick pattern, providing a comprehensive guide for traders and investors alike. We’ll explore its formation, interpretation, and how to effectively use it in conjunction with other technical indicators to enhance your trading strategy. Understanding the stocks hammer candlestick can provide valuable insights into market sentiment and potential future price movements.
What is a Hammer Candlestick?
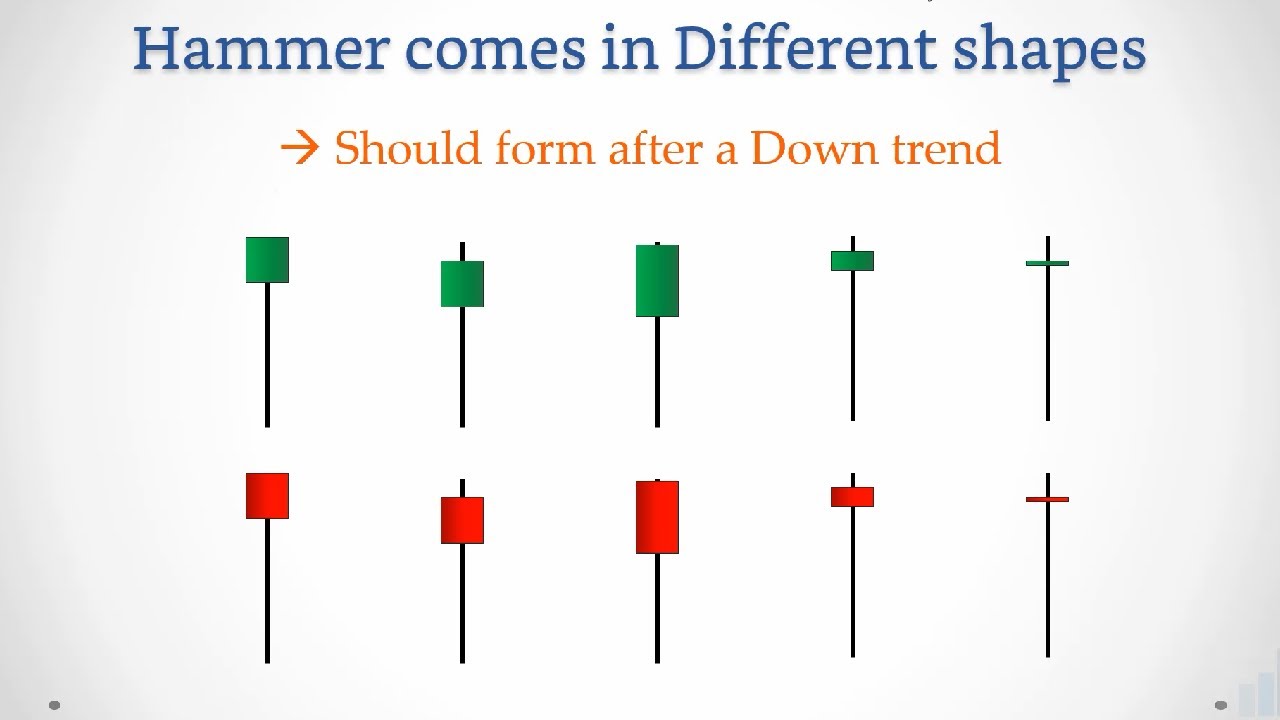
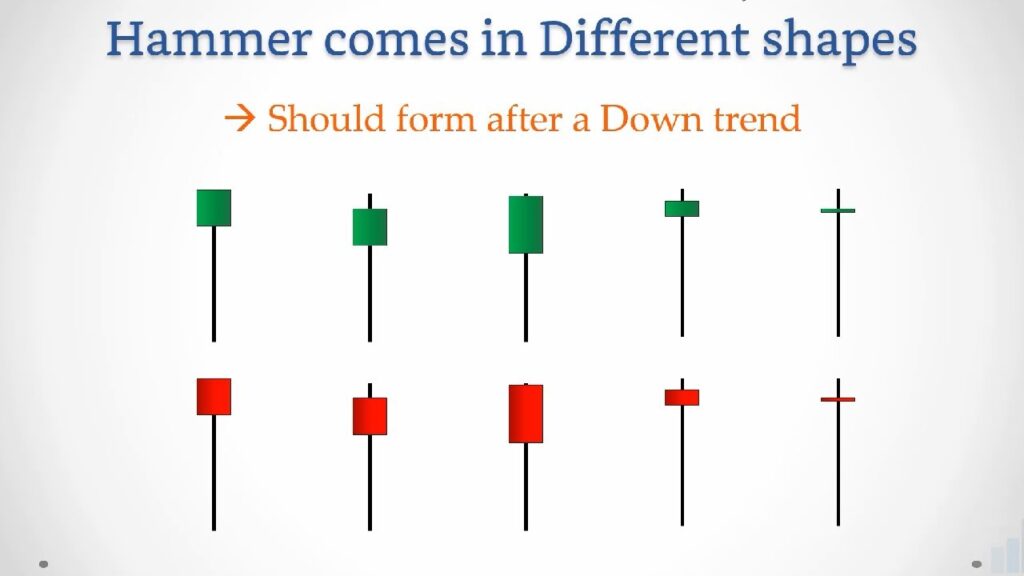
The hammer candlestick is a single-candlestick pattern that primarily appears at the bottom of a downtrend, signaling a possible bullish reversal. It’s characterized by a small body, a long lower shadow (or wick), and little to no upper shadow. The length of the lower shadow should be at least twice the length of the body. The color of the body (whether it’s bullish or bearish) is not as important as the shape of the candlestick itself, although a bullish (green or white) hammer can add more confirmation to the signal. In the context of stocks, spotting a hammer candlestick can be an early indicator of a potential price increase.
Key Characteristics of a Hammer
- Small Body: The real body represents the difference between the opening and closing prices. It should be relatively small compared to the lower shadow.
- Long Lower Shadow: The lower shadow indicates that during the trading period, the price went significantly lower but then recovered to close near the opening price. This shows that buyers stepped in and pushed the price back up.
- Little or No Upper Shadow: Ideally, there should be little to no upper shadow. A significant upper shadow weakens the hammer signal.
- Appears in a Downtrend: The hammer is only valid if it forms after a period of declining prices. It’s a reversal pattern, so it needs something to reverse.
How to Identify a Stocks Hammer Candlestick
Identifying a stocks hammer candlestick requires a keen eye and an understanding of the preceding market conditions. Here’s a step-by-step guide:
- Identify a Downtrend: Ensure that the market has been in a downtrend before looking for a hammer pattern. This is crucial because the hammer signals a potential reversal of this downtrend.
- Look for the Shape: The candlestick should have a small body and a long lower shadow that is at least twice the length of the body. The upper shadow should be minimal or nonexistent.
- Consider the Context: Analyze the surrounding candlesticks and trading volume. A hammer accompanied by increased volume can add more credibility to the signal.
- Confirmation: Wait for confirmation in the subsequent trading periods. This confirmation usually comes in the form of a bullish candlestick that closes above the high of the hammer.
The Psychology Behind the Hammer
The stocks hammer candlestick reflects a specific psychological battle between buyers and sellers. During the trading period, sellers initially pushed the price down significantly, creating the long lower shadow. However, buyers then stepped in, absorbing the selling pressure and driving the price back up towards the opening price. This indicates a shift in market sentiment from bearish to potentially bullish. The hammer shows that even though sellers tried to push the price lower, buyers were able to regain control, suggesting that the downtrend might be losing momentum. Understanding this underlying psychology is key to interpreting the stocks hammer candlestick effectively.
Trading Strategies Using the Hammer Candlestick
The hammer candlestick is a valuable tool, but it’s most effective when used in conjunction with other technical indicators and trading strategies. Here are some ways to incorporate the hammer into your trading plan:
Confirmation is Key
Never trade solely based on the appearance of a hammer. Always wait for confirmation. This usually means waiting for a bullish candlestick in the next trading period that closes above the high of the hammer. This confirms that the buyers have indeed taken control and that the downtrend is likely over.
Combine with Support and Resistance Levels
Look for hammers that form near key support levels. If a hammer appears at a known support level, it strengthens the bullish signal. This is because the support level acts as a barrier, preventing the price from falling further, while the hammer indicates that buyers are stepping in to defend that level. [See also: Identifying Key Support and Resistance Levels]
Use with Volume Analysis
Pay attention to the trading volume when a hammer forms. A hammer accompanied by increased volume suggests that there is strong buying interest at that price level. This adds more validity to the hammer signal and increases the likelihood of a bullish reversal.
Incorporate Other Indicators
Use other technical indicators, such as moving averages, RSI (Relative Strength Index), or MACD (Moving Average Convergence Divergence), to confirm the hammer signal. For example, if the RSI is oversold and a hammer forms, it can be a strong indication of a potential reversal. [See also: Using RSI to Identify Overbought and Oversold Conditions]
Examples of Hammer Candlestick in Stocks
Let’s consider a hypothetical example. Suppose you are tracking a stock that has been in a steady downtrend for several weeks. Suddenly, you notice a stocks hammer candlestick forming near a known support level. The hammer has a small body, a long lower shadow, and minimal upper shadow. Furthermore, the trading volume on that day was significantly higher than the average volume. The next day, a bullish candlestick forms, closing above the high of the hammer. This provides confirmation of the bullish reversal. Based on this analysis, you might consider entering a long position (buying the stock) with a stop-loss order placed below the low of the hammer to manage your risk.
Inverted Hammer: A Variation
Another candlestick pattern to be aware of is the inverted hammer. While the hammer signals a potential bullish reversal, the inverted hammer also suggests a possible change in trend. The inverted hammer has a small body at the bottom and a long upper shadow. It shows that buyers tried to push the price higher, but sellers ultimately pushed it back down. If the inverted hammer appears in a downtrend and is followed by a bullish confirmation, it can also signal a potential reversal. However, the inverted hammer is generally considered less reliable than the standard hammer.
Potential Pitfalls and How to Avoid Them
While the stocks hammer candlestick is a useful tool, it’s not foolproof. Here are some potential pitfalls to be aware of:
- False Signals: Hammers can sometimes give false signals, especially in volatile market conditions. This is why confirmation is so important.
- Ignoring the Context: Don’t focus solely on the hammer. Always consider the broader market context, including the overall trend, support and resistance levels, and economic news.
- Over-Reliance: Avoid relying solely on the hammer pattern. Use it in conjunction with other technical indicators and fundamental analysis to make well-informed trading decisions.
To avoid these pitfalls, always practice risk management. Set stop-loss orders to limit your potential losses, and never invest more than you can afford to lose. Continuously educate yourself about different trading strategies and market dynamics.
The Importance of Practice and Backtesting
Like any trading strategy, mastering the use of the stocks hammer candlestick requires practice and backtesting. Backtesting involves analyzing historical data to see how the hammer pattern has performed in the past. This can help you refine your trading rules and improve your overall profitability. Practice using the hammer pattern in a demo account before risking real money. This will allow you to gain experience and confidence in your ability to identify and trade the hammer effectively. [See also: The Benefits of Backtesting Your Trading Strategies]
Conclusion
The stocks hammer candlestick is a powerful tool for identifying potential bullish reversals in the stock market. By understanding its formation, interpretation, and limitations, traders and investors can use it to enhance their trading strategies. Remember to always wait for confirmation, combine the hammer with other technical indicators, and practice risk management. With dedication and continuous learning, you can effectively incorporate the stocks hammer candlestick into your trading toolkit and improve your overall trading performance. The ability to recognize and interpret the stocks hammer candlestick can significantly improve your understanding of market dynamics and potentially lead to more profitable trading decisions. Always remember that the stocks hammer candlestick, like any technical indicator, is just one piece of the puzzle. A comprehensive approach to trading, incorporating both technical and fundamental analysis, is crucial for long-term success. So, continue to learn, adapt, and refine your strategies, and you’ll be well on your way to becoming a more successful trader. Recognizing the stocks hammer candlestick and its implications can provide a significant edge in the competitive world of stock trading.
