
Mastering the MACD RSI Indicator: A Comprehensive Guide for Traders
In the dynamic world of trading, technical indicators serve as invaluable tools for analyzing market trends and making informed decisions. Among the plethora of indicators available, the Moving Average Convergence Divergence (MACD) and the Relative Strength Index (RSI) stand out as two of the most popular and effective. This comprehensive guide delves into the intricacies of the MACD RSI indicator, exploring its components, how to interpret its signals, and strategies for incorporating it into your trading arsenal.
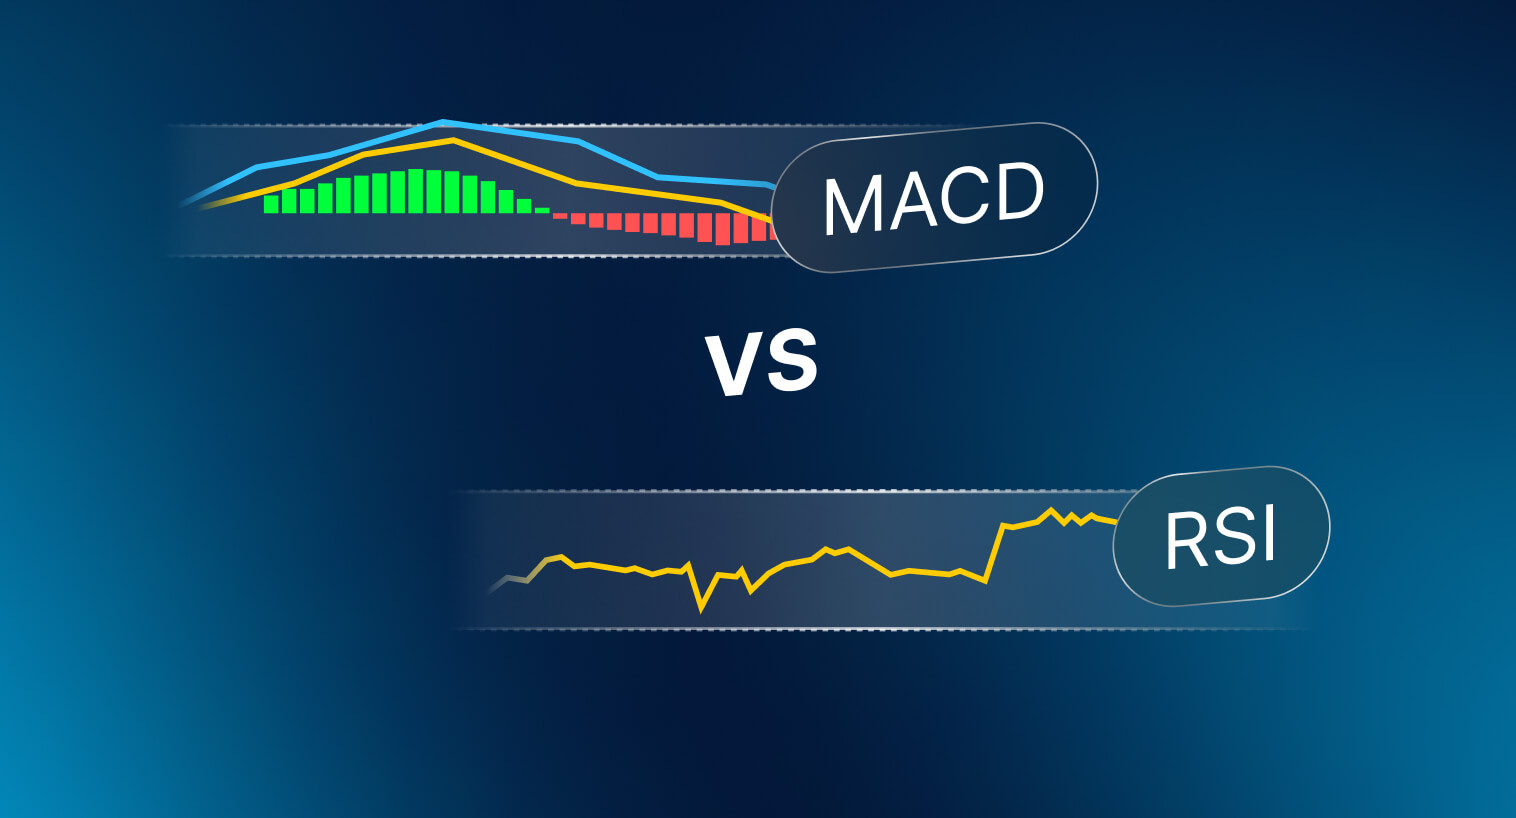
Understanding the MACD Indicator
The Moving Average Convergence Divergence (MACD) is a momentum indicator that reveals changes in the strength, direction, momentum, and duration of a trend in a stock’s price. Developed by Gerald Appel in the late 1970s, the MACD comprises three main components:
- MACD Line: Calculated by subtracting the 26-period Exponential Moving Average (EMA) from the 12-period EMA.
- Signal Line: A 9-period EMA of the MACD line.
- Histogram: Represents the difference between the MACD line and the signal line.
The MACD oscillates above and below the zero line, which serves as a crucial reference point. Traders often look for crossovers of the MACD line and the signal line to identify potential buy or sell signals. A bullish crossover occurs when the MACD line crosses above the signal line, suggesting upward momentum. Conversely, a bearish crossover happens when the MACD line crosses below the signal line, indicating downward momentum.
Interpreting MACD Signals
Beyond crossovers, the MACD offers several other signals that traders can use:
- Divergence: Occurs when the price of an asset moves in the opposite direction of the MACD. For example, if the price is making new highs but the MACD is failing to do so, it could be a sign of weakening momentum and a potential reversal.
- Centerline Crossovers: When the MACD crosses above the zero line, it indicates a bullish trend, while a cross below the zero line suggests a bearish trend.
- Histogram Analysis: The histogram provides a visual representation of the momentum behind the MACD. Increasing histogram values indicate strengthening momentum, while decreasing values suggest weakening momentum.
Understanding the RSI Indicator
The Relative Strength Index (RSI) is a momentum oscillator that measures the speed and change of price movements. Developed by J. Welles Wilder Jr., the RSI ranges from 0 to 100 and is typically used to identify overbought and oversold conditions in the market.
The RSI is calculated using the following formula:
RSI = 100 – [100 / (1 + (Average Gain / Average Loss))]
Typically, an RSI value above 70 indicates that an asset is overbought and may be due for a correction, while an RSI value below 30 suggests that an asset is oversold and may be poised for a bounce.
Interpreting RSI Signals
Similar to the MACD, the RSI offers several signals that traders can use to inform their decisions:
- Overbought and Oversold Levels: As mentioned earlier, values above 70 and below 30 are considered overbought and oversold, respectively. However, it’s crucial to remember that these levels can be sustained for extended periods during strong trends.
- Divergence: RSI divergence occurs when the price of an asset moves in the opposite direction of the RSI. This can be a powerful signal of a potential trend reversal.
- Centerline Crossovers: While less common than overbought/oversold signals, crossing the 50 level can provide insights into the trend. A move above 50 suggests bullish momentum, while a move below 50 indicates bearish momentum.
Combining the MACD and RSI: A Powerful Synergy
While both the MACD and RSI are valuable indicators on their own, combining them can create a powerful synergy that enhances the accuracy of trading signals. The MACD RSI indicator strategy involves using both indicators in conjunction to confirm potential trading opportunities.
By using both indicators, traders can filter out false signals and increase the probability of successful trades. The MACD is particularly useful for identifying the direction and strength of a trend, while the RSI can help pinpoint overbought and oversold conditions, potentially signaling when a trend may be nearing its end or when a pullback might be imminent. The MACD RSI indicator combination offers a more holistic view of market dynamics.
Strategies for Using the MACD RSI Indicator
Here are a few strategies for incorporating the MACD RSI indicator into your trading plan:
- Confirmation of Signals: Look for instances where both the MACD and RSI generate the same signal. For example, if the MACD signals a bullish crossover and the RSI is also above 50, it could be a stronger indication of an upward trend.
- Divergence Confluence: Identify situations where both the MACD and RSI show divergence from the price action. This confluence of divergence signals can be a particularly powerful indication of a potential trend reversal.
- Overbought/Oversold Confirmation: Use the RSI to confirm overbought or oversold conditions identified by the MACD. For example, if the MACD histogram shows weakening momentum and the RSI is in overbought territory, it could be a sign to take profits on a long position.
Practical Examples of MACD RSI Indicator in Action
Let’s consider a few hypothetical scenarios to illustrate how the MACD RSI indicator can be applied in real-world trading situations.
Scenario 1: Identifying a Potential Long Entry
Imagine you are analyzing a stock that has been trending downwards. You notice that the MACD line is about to cross above the signal line, suggesting a potential bullish reversal. However, you want to confirm this signal before entering a long position. You then check the RSI and observe that it is below 30, indicating oversold conditions. The confluence of the bullish MACD crossover and the oversold RSI provides a stronger signal to enter a long position.
Scenario 2: Identifying a Potential Short Entry
Now, consider a stock that has been trending upwards. The MACD histogram shows decreasing momentum, and the MACD line is approaching a bearish crossover. To confirm this signal, you check the RSI and find that it is above 70, indicating overbought conditions. The combination of the bearish MACD signal and the overbought RSI suggests a potential short entry.
Scenario 3: Avoiding False Signals
Suppose the MACD generates a bullish crossover, but the RSI is hovering around 50. This lack of confirmation from the RSI suggests that the bullish signal may be weak, and it might be prudent to wait for further confirmation before entering a long position. The MACD RSI indicator helps filter out potentially false signals.
Tips for Using the MACD RSI Indicator Effectively
To maximize the effectiveness of the MACD RSI indicator, consider the following tips:
- Use in Conjunction with Other Indicators: While the MACD RSI indicator is a powerful tool, it’s essential to use it in conjunction with other technical indicators and chart patterns to gain a more comprehensive view of the market.
- Consider the Timeframe: The effectiveness of the MACD RSI indicator can vary depending on the timeframe used. Experiment with different timeframes to find the one that works best for your trading style.
- Adjust Parameters: The default parameters for the MACD and RSI (e.g., 12, 26, 9 for MACD and 14 for RSI) may not be optimal for all assets or market conditions. Consider adjusting these parameters to better suit your specific needs.
- Practice Risk Management: Always practice proper risk management techniques, such as setting stop-loss orders and managing your position size, to protect your capital.
The Importance of Backtesting
Before implementing any trading strategy based on the MACD RSI indicator, it’s crucial to backtest it using historical data. Backtesting allows you to evaluate the performance of the strategy under different market conditions and identify potential weaknesses. This process can help you refine your strategy and improve its profitability.
Conclusion
The MACD RSI indicator is a valuable tool for traders of all levels. By understanding the components of the MACD and RSI, how to interpret their signals, and strategies for combining them, you can enhance your trading decisions and improve your overall performance. Remember to use the MACD RSI indicator in conjunction with other technical indicators and chart patterns, and always practice proper risk management techniques. With consistent practice and refinement, the MACD RSI indicator can become a powerful asset in your trading toolkit. The MACD RSI indicator provides a robust, two-pronged approach to market analysis. Understanding the nuances of the MACD RSI indicator and applying it judiciously can significantly enhance trading outcomes. Always remember to factor in market volatility and adjust your strategy accordingly when using the MACD RSI indicator. Finally, continuous learning and adaptation are key to mastering the MACD RSI indicator and achieving consistent success in the financial markets. [See also: Understanding Technical Indicators for Day Trading] [See also: RSI vs Stochastic Oscillator: Which Indicator Is Best?] [See also: How to Use Moving Averages in Trading]
