Mastering the MACD RSI Strategy: A Comprehensive Guide for Traders
In the dynamic world of trading, combining multiple indicators can often lead to more robust and reliable signals. One such powerful combination is the MACD RSI strategy, which merges the strengths of the Moving Average Convergence Divergence (MACD) and the Relative Strength Index (RSI). This strategy aims to provide traders with a clearer picture of market momentum and potential reversal points. This comprehensive guide will delve into the intricacies of the MACD RSI strategy, exploring its components, application, and potential benefits and drawbacks.
Understanding the Components: MACD and RSI
Before diving into the combined strategy, it’s crucial to understand the individual indicators. The MACD, developed by Gerald Appel in the late 1970s, is a trend-following momentum indicator that shows the relationship between two moving averages of a security’s price. It is calculated by subtracting the 26-period Exponential Moving Average (EMA) from the 12-period EMA. The result is the MACD line. A 9-period EMA of the MACD line is plotted as the signal line, which acts as a trigger for buy and sell signals.
The MACD Explained
The MACD primarily generates signals based on crossovers, divergences, and centerline crossovers. A bullish crossover occurs when the MACD line crosses above the signal line, suggesting upward momentum. Conversely, a bearish crossover happens when the MACD line crosses below the signal line, indicating downward momentum. Divergences occur when the price action diverges from the MACD. For example, if the price is making higher highs but the MACD is making lower highs, it suggests a potential bearish reversal. Centerline crossovers occur when the MACD line crosses above or below the zero line, confirming the prevailing trend.
The RSI Explained
The Relative Strength Index (RSI), developed by J. Welles Wilder Jr., is a momentum oscillator that measures the speed and change of price movements. It oscillates between 0 and 100. Traditionally, the RSI is considered overbought when above 70 and oversold when below 30. These levels can indicate potential trend reversals or pullbacks. The RSI is calculated using the following formula:
RSI = 100 – [100 / (1 + (Average Gain / Average Loss))]
The RSI can also be used to identify divergences. A bullish divergence occurs when the price makes lower lows, but the RSI makes higher lows, suggesting a potential bullish reversal. A bearish divergence occurs when the price makes higher highs, but the RSI makes lower highs, suggesting a potential bearish reversal.
Combining MACD and RSI: The Synergy
The MACD RSI strategy leverages the strengths of both indicators to provide more reliable trading signals. By combining these two, traders can filter out false signals and increase the probability of successful trades. The MACD provides information about the trend and momentum, while the RSI helps identify overbought and oversold conditions. Using them together allows for a more nuanced understanding of market dynamics.
How the MACD RSI Strategy Works
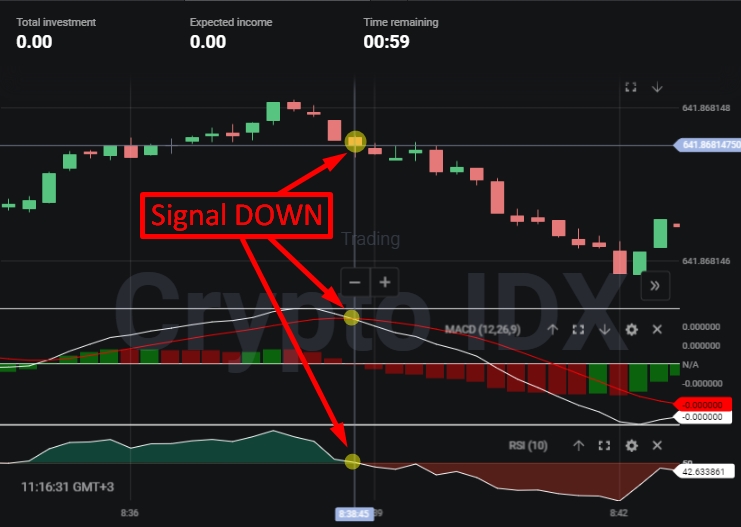
The basic premise of the MACD RSI strategy is to look for confluence between the signals generated by both indicators. For example, a buy signal might be triggered when the MACD line crosses above the signal line, and the RSI is below 30, indicating an oversold condition. Conversely, a sell signal might be triggered when the MACD line crosses below the signal line, and the RSI is above 70, indicating an overbought condition. Let’s explore specific scenarios:
- Bullish Scenario: MACD bullish crossover + RSI below 30 (oversold) = Potential Buy Signal
- Bearish Scenario: MACD bearish crossover + RSI above 70 (overbought) = Potential Sell Signal
Additionally, traders often look for divergences in both indicators. If both the MACD and RSI show bullish divergence, it strengthens the case for a potential bullish reversal. Similarly, if both show bearish divergence, it strengthens the case for a potential bearish reversal.
Implementing the MACD RSI Strategy
Implementing the MACD RSI strategy requires a systematic approach. Here’s a step-by-step guide:
- Set up your chart: Add the MACD and RSI indicators to your trading chart. Ensure the settings are appropriate for your trading style. Common settings are 12 and 26 periods for the MACD EMAs and 9 periods for the signal line. For RSI, the standard period is 14.
- Identify potential buy signals: Look for instances where the MACD line crosses above the signal line, and the RSI is below 30. This suggests that the asset is oversold and has bullish momentum.
- Identify potential sell signals: Look for instances where the MACD line crosses below the signal line, and the RSI is above 70. This suggests that the asset is overbought and has bearish momentum.
- Confirm with other indicators or price action: While the MACD RSI strategy can be effective, it’s important to confirm signals with other indicators or price action patterns. For example, look for candlestick patterns that support the signal.
- Set stop-loss and take-profit levels: Before entering a trade, always set appropriate stop-loss and take-profit levels to manage risk. A common approach is to place the stop-loss just below a recent swing low for long positions and just above a recent swing high for short positions.
- Monitor and adjust: Continuously monitor the trade and adjust your stop-loss and take-profit levels as needed.
Advantages of Using the MACD RSI Strategy
There are several advantages to using the MACD RSI strategy:
- Improved signal reliability: By combining two indicators, the strategy can filter out false signals and improve the reliability of trading decisions.
- Comprehensive market view: The strategy provides a more comprehensive view of market dynamics by considering both trend and momentum, as well as overbought and oversold conditions.
- Versatility: The strategy can be applied to various markets and timeframes, making it suitable for different trading styles.
- Easy to understand: Both the MACD and RSI are relatively easy to understand, making the strategy accessible to both novice and experienced traders.
Disadvantages and Limitations
Despite its advantages, the MACD RSI strategy also has some limitations:
- Lagging indicators: Both the MACD and RSI are lagging indicators, meaning they are based on past price data. This can result in delayed signals and missed opportunities.
- Whipsaws: In choppy or sideways markets, the strategy can generate false signals, leading to whipsaws and losses.
- Parameter sensitivity: The performance of the strategy can be sensitive to the choice of parameters. Traders need to experiment with different settings to find what works best for their trading style and the specific market they are trading.
- Not foolproof: No trading strategy is foolproof. The MACD RSI strategy should be used in conjunction with other forms of analysis and risk management techniques.
Risk Management Considerations
Effective risk management is crucial when using the MACD RSI strategy. Here are some key considerations:
- Stop-loss orders: Always use stop-loss orders to limit potential losses. Place the stop-loss at a level that makes sense based on the market structure and your risk tolerance.
- Position sizing: Carefully consider your position size. Do not risk more than a small percentage of your trading capital on any single trade. A common rule of thumb is to risk no more than 1-2% of your capital per trade.
- Diversification: Diversify your portfolio across different assets and markets to reduce overall risk.
- Continuous learning: Stay informed about market conditions and continue to learn about trading strategies and risk management techniques.
Examples of MACD RSI Strategy in Action
Let’s consider a few hypothetical examples to illustrate how the MACD RSI strategy can be applied.
Example 1: Bullish Trade
Suppose you are analyzing a stock, and you notice that the MACD line has just crossed above the signal line. At the same time, the RSI is at 28, indicating an oversold condition. This confluence of signals suggests a potential bullish trade. You decide to enter a long position, placing your stop-loss just below a recent swing low and setting a take-profit target based on a risk-reward ratio of 1:2.
Example 2: Bearish Trade
Now, imagine you are analyzing a currency pair, and you observe that the MACD line has crossed below the signal line. Simultaneously, the RSI is at 72, indicating an overbought condition. This confluence of signals suggests a potential bearish trade. You decide to enter a short position, placing your stop-loss just above a recent swing high and setting a take-profit target based on a risk-reward ratio of 1:2.
[See also: Understanding Moving Averages in Trading]
[See also: RSI Divergence Trading Strategy]
Backtesting the MACD RSI Strategy
Before using the MACD RSI strategy in live trading, it’s essential to backtest it using historical data. Backtesting allows you to evaluate the performance of the strategy and optimize its parameters. Here are the key steps involved in backtesting:
- Gather historical data: Collect historical price data for the asset you want to trade. Ensure the data is accurate and reliable.
- Define entry and exit rules: Clearly define the rules for entering and exiting trades based on the MACD RSI strategy.
- Simulate trades: Simulate trades based on the defined rules and historical data. Track the results of each trade, including the entry price, exit price, profit or loss, and duration.
- Analyze the results: Analyze the results of the backtest to evaluate the performance of the strategy. Calculate key metrics such as the win rate, average profit per trade, average loss per trade, and maximum drawdown.
- Optimize parameters: Experiment with different parameters for the MACD and RSI to optimize the performance of the strategy.
Conclusion
The MACD RSI strategy offers a powerful approach to trading by combining the strengths of two popular indicators. By understanding the components of the strategy, implementing it systematically, and managing risk effectively, traders can potentially improve their trading performance. However, it’s crucial to remember that no strategy is foolproof, and the MACD RSI strategy should be used in conjunction with other forms of analysis and risk management techniques. Continuous learning and adaptation are key to success in the ever-evolving world of trading. Always remember to conduct thorough backtesting and paper trading before deploying any strategy with real capital. The synergy between the MACD and RSI can provide valuable insights into market momentum and potential turning points, but ultimately, successful trading requires discipline, patience, and a well-defined risk management plan. The MACD RSI strategy, when used judiciously, can be a valuable tool in a trader’s arsenal. Remember to always prioritize risk management and adapt the strategy to your individual trading style and market conditions. The MACD RSI strategy can be a powerful tool when used correctly.
