Mastering the MACD RSI Strategy: A Comprehensive Guide for Traders
In the dynamic world of financial trading, identifying potential entry and exit points is crucial for success. Technical analysis offers a range of tools and indicators to help traders make informed decisions. Among these, the Moving Average Convergence Divergence (MACD) and the Relative Strength Index (RSI) are two of the most popular and versatile indicators. This article delves into the intricacies of combining the MACD RSI strategy, providing a comprehensive guide for traders seeking to enhance their trading strategies.
The MACD RSI strategy, when implemented correctly, can offer a robust framework for identifying potential trading opportunities by filtering out false signals and confirming trends. We’ll explore the individual components of this strategy, how they work together, and provide practical examples of how to apply it in real-world trading scenarios. Whether you’re a seasoned trader or just starting out, understanding the MACD RSI strategy can significantly improve your trading outcomes.
Understanding the MACD Indicator
The Moving Average Convergence Divergence (MACD) is a momentum indicator that shows the relationship between two moving averages of a security’s price. It consists of the MACD line, the signal line, and the histogram. The MACD line is calculated by subtracting the 26-period Exponential Moving Average (EMA) from the 12-period EMA. The signal line is a 9-period EMA of the MACD line.
How it Works:
- MACD Line: Reflects the difference between two EMAs.
- Signal Line: Acts as a smoother version of the MACD line.
- Histogram: Visually represents the difference between the MACD line and the signal line.
Interpreting MACD Signals:
- Crossovers: When the MACD line crosses above the signal line, it’s considered a bullish signal, suggesting potential upward momentum. Conversely, when the MACD line crosses below the signal line, it’s a bearish signal, indicating potential downward momentum.
- Divergence: Bullish divergence occurs when the price makes lower lows, but the MACD makes higher lows, suggesting a potential reversal to the upside. Bearish divergence occurs when the price makes higher highs, but the MACD makes lower highs, suggesting a potential reversal to the downside.
- Histogram Analysis: The histogram provides additional insight into the strength of the trend. Increasing histogram values indicate strengthening momentum, while decreasing values suggest weakening momentum.
Understanding the RSI Indicator
The Relative Strength Index (RSI) is a momentum oscillator that measures the magnitude of recent price changes to evaluate overbought or oversold conditions in the price of a stock or other asset. It ranges from 0 to 100. Traditionally, an RSI above 70 is considered overbought, and an RSI below 30 is considered oversold.
How it Works:
The RSI calculates the ratio of average gains to average losses over a specified period (typically 14 periods). The formula is as follows:
RSI = 100 – [100 / (1 + (Average Gain / Average Loss))]
Interpreting RSI Signals:
- Overbought/Oversold Levels: An RSI above 70 suggests that the asset is overbought and may be due for a pullback. An RSI below 30 suggests that the asset is oversold and may be due for a bounce.
- Divergence: Bullish divergence occurs when the price makes lower lows, but the RSI makes higher lows, suggesting a potential reversal to the upside. Bearish divergence occurs when the price makes higher highs, but the RSI makes lower highs, suggesting a potential reversal to the downside.
- Centerline Crossovers: Crossing above or below the 50 level can indicate the strength of the trend.
Combining MACD and RSI: The MACD RSI Strategy
The real power of the MACD RSI strategy lies in combining the strengths of both indicators to filter out false signals and confirm potential trading opportunities. By using the MACD to identify the trend and the RSI to identify overbought or oversold conditions, traders can increase the probability of successful trades.
Key Principles of the MACD RSI Strategy:
- Trend Identification: Use the MACD to identify the overall trend. Look for MACD line crossovers above the signal line for potential long positions and crossovers below the signal line for potential short positions.
- Overbought/Oversold Confirmation: Use the RSI to confirm overbought or oversold conditions. Look for RSI readings above 70 for potential short positions and RSI readings below 30 for potential long positions.
- Divergence Confirmation: Look for divergence between the price and both the MACD and RSI to further confirm potential reversals.
- Confirmation with Price Action: Always confirm signals with price action. Look for candlestick patterns or other price action signals that support the indications from the MACD and RSI.
Implementing the MACD RSI Strategy: Step-by-Step Guide
To effectively implement the MACD RSI strategy, follow these steps:
Step 1: Set Up Your Charts
Add both the MACD and RSI indicators to your trading chart. Use the default settings for both indicators (12, 26, 9 for MACD and 14 for RSI).
Step 2: Identify the Trend with MACD
Determine the overall trend using the MACD. If the MACD line is consistently above the signal line, the trend is likely bullish. If the MACD line is consistently below the signal line, the trend is likely bearish.
Step 3: Look for Overbought/Oversold Conditions with RSI
Check the RSI to identify potential overbought or oversold conditions. If the RSI is above 70, the asset may be overbought. If the RSI is below 30, the asset may be oversold.
Step 4: Combine Signals for Entry
For a long entry, look for the MACD line to cross above the signal line while the RSI is below 30. This suggests that the asset is oversold and the trend is turning bullish. For a short entry, look for the MACD line to cross below the signal line while the RSI is above 70. This suggests that the asset is overbought and the trend is turning bearish.
Step 5: Set Stop-Loss and Take-Profit Levels
Set stop-loss orders to limit potential losses and take-profit orders to secure profits. Common strategies include placing stop-loss orders below recent swing lows for long positions and above recent swing highs for short positions. Take-profit levels can be based on Fibonacci retracement levels, support and resistance levels, or a fixed risk-reward ratio.
Step 6: Monitor and Adjust
Continuously monitor your trades and adjust your stop-loss and take-profit levels as the price moves. Be prepared to exit the trade if the conditions that led to the entry change.
Examples of the MACD RSI Strategy in Action
Let’s look at a couple of hypothetical examples to illustrate how the MACD RSI strategy can be applied in real-world trading scenarios.
Example 1: Identifying a Long Entry
Imagine a stock has been in a downtrend for several weeks. The MACD line is below the signal line, indicating a bearish trend. However, the RSI has fallen below 30, suggesting that the stock is oversold. Suddenly, the MACD line crosses above the signal line, signaling a potential trend reversal. This combination of signals suggests a potential long entry. A trader might enter a long position, placing a stop-loss order below the recent swing low and a take-profit order at a predetermined level based on resistance or Fibonacci retracement.
Example 2: Identifying a Short Entry
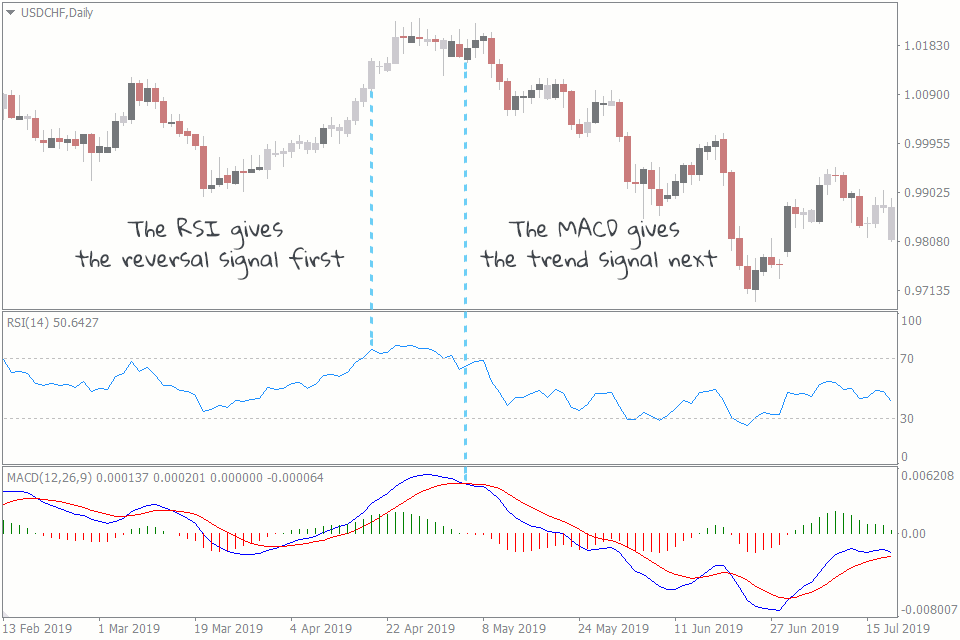
Consider a stock that has been in an uptrend for several weeks. The MACD line is above the signal line, indicating a bullish trend. However, the RSI has risen above 70, suggesting that the stock is overbought. The MACD line then crosses below the signal line, signaling a potential trend reversal. This combination of signals suggests a potential short entry. A trader might enter a short position, placing a stop-loss order above the recent swing high and a take-profit order at a predetermined level based on support or Fibonacci retracement.
Advantages and Disadvantages of the MACD RSI Strategy
Like any trading strategy, the MACD RSI strategy has its advantages and disadvantages.
Advantages:
- Filters False Signals: By combining two different types of indicators (momentum and oscillator), the strategy helps filter out false signals and confirm potential trading opportunities.
- Identifies Trend Reversals: The strategy can be effective in identifying potential trend reversals by combining MACD crossovers with RSI overbought/oversold conditions.
- Versatile: The strategy can be applied to a wide range of assets and timeframes.
Disadvantages:
- Lagging Indicators: Both the MACD and RSI are lagging indicators, meaning they are based on past price data. This can lead to delayed signals and missed opportunities.
- Whipsaws: In choppy or sideways markets, the strategy can generate false signals, leading to whipsaws and losses.
- Requires Confirmation: The strategy should always be used in conjunction with other forms of analysis, such as price action and fundamental analysis.
Tips for Enhancing the MACD RSI Strategy
To maximize the effectiveness of the MACD RSI strategy, consider the following tips:
- Use Multiple Timeframes: Analyze the MACD and RSI on multiple timeframes to get a more comprehensive view of the market.
- Adjust Settings: Experiment with different settings for the MACD and RSI to find the optimal settings for your trading style and the specific asset you are trading.
- Combine with Other Indicators: Use other indicators, such as volume and moving averages, to further confirm signals and filter out false positives.
- Practice Risk Management: Always use proper risk management techniques, such as setting stop-loss orders and limiting the amount of capital you risk on each trade.
- Backtest the Strategy: Before implementing the strategy in live trading, backtest it on historical data to evaluate its performance and identify potential weaknesses.
Conclusion
The MACD RSI strategy is a powerful tool that can help traders identify potential trading opportunities and improve their overall trading performance. By combining the strengths of the MACD and RSI indicators, traders can filter out false signals, confirm trends, and increase the probability of successful trades. However, it is important to remember that no trading strategy is foolproof, and the MACD RSI strategy should always be used in conjunction with other forms of analysis and proper risk management techniques. With practice and discipline, the MACD RSI strategy can be a valuable addition to any trader’s toolkit. Remember that the MACD RSI strategy is just one tool, and continuous learning and adaptation are key to long-term success in the markets. The MACD RSI strategy can be enhanced by considering market context and news events. Understanding the nuances of the MACD RSI strategy can lead to more informed trading decisions. Using the MACD RSI strategy effectively requires patience and discipline. The MACD RSI strategy can be a cornerstone of a comprehensive trading plan. Always refine your approach to the MACD RSI strategy based on your experiences and market conditions. Finally, remember to practice the MACD RSI strategy in a demo account before using real funds.
[See also: Understanding Technical Indicators for Trading] [See also: Risk Management Strategies for Day Traders]
