Retracement Meaning: Understanding Market Pullbacks and Opportunities
In the dynamic world of financial markets, understanding price movements is crucial for making informed investment decisions. One such movement is a retracement, a temporary reversal in the prevailing price trend of an asset. Understanding the retracement meaning and its implications can help traders and investors identify potential entry and exit points, manage risk, and ultimately improve their trading strategies.
This article delves into the retracement meaning, explores its characteristics, differentiates it from a reversal, and provides practical strategies for incorporating it into your trading toolkit. We’ll cover key concepts like Fibonacci retracement levels, common patterns, and real-world examples to illustrate how to effectively analyze and trade retracements.
What is a Retracement?
A retracement is a short-term price movement against the primary trend of an asset. It’s a temporary pullback or correction before the price resumes its overall direction. Think of it like a brief pause in a runner’s stride before they continue their race. These pullbacks offer opportunities for traders to enter the market in the direction of the dominant trend at a potentially better price.
The retracement meaning is often confused with a full-blown reversal, but the critical distinction lies in its duration and impact on the underlying trend. A retracement is a temporary phenomenon, while a reversal signifies a significant change in the overall market direction. Identifying which one is occurring is essential for effective trading.
Retracement vs. Reversal: Key Differences
Distinguishing between a retracement and a reversal is vital for accurate market analysis. Here’s a breakdown of the key differences:
- Duration: Retracements are typically short-lived, lasting from a few days to a few weeks. Reversals, on the other hand, represent a more sustained change in price direction, potentially lasting for months or even years.
- Magnitude: Retracements usually involve a smaller percentage pullback of the original trend. Reversals often involve a more substantial price movement that breaks through significant support or resistance levels.
- Trend Confirmation: Retracements are followed by a continuation of the original trend. Reversals mark the beginning of a new trend in the opposite direction.
- Volume: Volume often decreases during a retracement, suggesting a lack of strong conviction against the primary trend. Reversals are typically accompanied by a surge in volume, indicating strong buying or selling pressure.
Understanding these differences is crucial for avoiding false signals and making informed trading decisions. Mistaking a retracement for a reversal can lead to premature exits or entries, resulting in losses.
Identifying Retracements: Tools and Techniques
Several tools and techniques can help traders identify potential retracements and anticipate their magnitude. Here are some of the most commonly used methods:
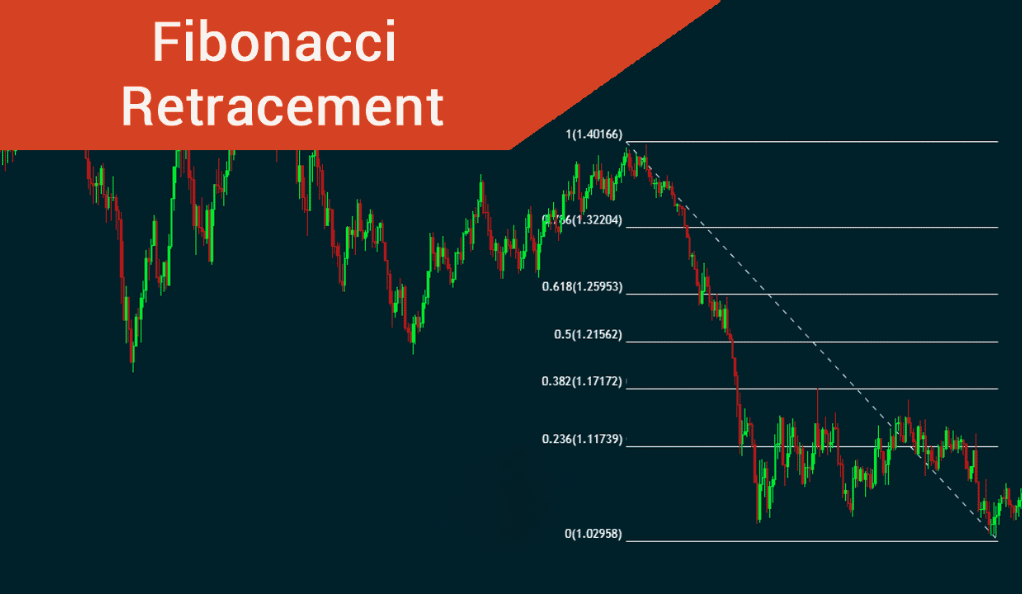
Fibonacci Retracement Levels
Fibonacci retracement levels are horizontal lines drawn on a chart to indicate potential support and resistance levels where a retracement might end. These levels are based on the Fibonacci sequence, a series of numbers where each number is the sum of the two preceding ones (e.g., 0, 1, 1, 2, 3, 5, 8, 13…). The key Fibonacci retracement levels are 23.6%, 38.2%, 50%, 61.8%, and 78.6%.
To use Fibonacci retracement levels, identify a significant swing high and swing low on a chart. Then, apply the Fibonacci retracement tool, which will automatically draw the horizontal lines at the corresponding percentage levels. Traders often look for price to stall or reverse near these levels, providing potential entry points in the direction of the primary trend. [See also: Fibonacci Trading Strategies]
Trendlines
Trendlines are lines drawn on a chart connecting a series of higher lows (in an uptrend) or lower highs (in a downtrend). Trendlines can act as dynamic support or resistance levels, and a retracement might find support or resistance along a trendline. A break of a trendline can sometimes signal a potential reversal, but it’s important to confirm this with other indicators.
Moving Averages
Moving averages smooth out price data and can help identify the overall trend. Commonly used moving averages include the 50-day, 100-day, and 200-day moving averages. A retracement might find support at a moving average, and a bounce off the moving average can signal a continuation of the primary trend.
Chart Patterns
Certain chart patterns can also indicate potential retracements. For example, a flag pattern is a short-term consolidation that occurs after a strong price move. It’s considered a continuation pattern, suggesting that the price will likely resume its original direction after the consolidation phase. Other patterns like pennants and wedges can also provide clues about potential retracements.
Trading Strategies Using Retracements
Once you’ve identified a potential retracement, you can use several trading strategies to capitalize on the opportunity. Here are a few examples:
Buy the Dip (Uptrend)
In an uptrend, a retracement offers an opportunity to “buy the dip.” This involves waiting for the price to pull back to a support level (e.g., a Fibonacci retracement level, a trendline, or a moving average) and then entering a long position, anticipating that the price will resume its upward trajectory. It’s crucial to set a stop-loss order below the support level to manage risk.
Sell the Rally (Downtrend)
In a downtrend, a retracement offers an opportunity to “sell the rally.” This involves waiting for the price to rally to a resistance level and then entering a short position, anticipating that the price will resume its downward trajectory. Again, it’s important to set a stop-loss order above the resistance level to manage risk.
Confirmation Signals
Regardless of the strategy you choose, it’s essential to look for confirmation signals before entering a trade. Confirmation signals can include candlestick patterns (e.g., bullish or bearish engulfing patterns), momentum indicators (e.g., RSI or MACD), or volume spikes. These signals can help increase the probability of a successful trade.
Risk Management Considerations
Trading retracements involves inherent risks, and it’s crucial to implement effective risk management strategies. Here are some key considerations:
- Stop-Loss Orders: Always use stop-loss orders to limit potential losses. Place your stop-loss order below support levels (in an uptrend) or above resistance levels (in a downtrend).
- Position Sizing: Adjust your position size based on your risk tolerance and the volatility of the asset. Avoid risking more than a small percentage of your trading capital on any single trade.
- Diversification: Diversify your portfolio across different assets and markets to reduce overall risk.
- Patience: Be patient and wait for high-probability setups. Avoid chasing trades or entering the market impulsively.
Real-World Examples of Retracements
To illustrate the retracement meaning in practice, let’s consider a few real-world examples:
Example 1: Apple (AAPL) Uptrend
Imagine Apple stock is in a strong uptrend. After a significant price surge, the stock experiences a temporary pullback, retracing to the 38.2% Fibonacci retracement level. Traders who identify this retracement might enter a long position, anticipating that the stock will resume its upward trend. A stop-loss order would be placed below the 38.2% level to manage risk.
Example 2: Bitcoin (BTC) Downtrend
Consider Bitcoin in a downtrend. After a sharp price decline, Bitcoin experiences a rally, retracing to a trendline resistance level. Traders who identify this retracement might enter a short position, anticipating that Bitcoin will resume its downward trend. A stop-loss order would be placed above the trendline to manage risk.
Conclusion
Understanding the retracement meaning is essential for navigating the complexities of financial markets. By learning to identify retracements, using appropriate trading strategies, and implementing effective risk management techniques, traders and investors can potentially improve their profitability and reduce their risk. Remember that practice and continuous learning are key to mastering the art of trading retracements. Always conduct thorough research and consult with a financial advisor before making any investment decisions. The ability to recognize and act upon a retracement separates informed investors from those who make decisions based on emotion or speculation. By understanding the nuance of retracement meaning, you are better equipped to make strategic moves in the market, capitalizing on temporary pullbacks to achieve your financial goals. The consistent application of these principles, combined with diligent market analysis, will pave the way for more confident and potentially rewarding trading experiences. Remember that a solid understanding of the retracement meaning is just one tool in a trader’s arsenal, but it’s a powerful one when used correctly. [See also: Advanced Chart Patterns]
