
Retracement Meaning: Understanding Market Pullbacks and Opportunities
In the dynamic world of financial markets, understanding price movements is crucial for making informed investment decisions. One such movement is a retracement, a temporary price reversal within a larger trend. This article will delve into the retracement meaning, exploring its significance, how to identify it, and strategies for leveraging it to your advantage.
What is a Retracement? A Detailed Explanation
A retracement, in its simplest form, is a temporary dip or rise in a stock’s price that occurs within an existing upward or downward trend. It’s essentially a pullback from the prevailing trend before the price continues in its original direction. Understanding the retracement meaning involves recognizing it as a normal and often healthy part of market behavior. It allows markets to consolidate, investors to re-evaluate positions, and new opportunities to emerge.
Think of it like a runner taking a breather during a marathon. The runner is still aiming to finish the race (the overall trend), but they pause momentarily to regain energy. Similarly, a stock might experience a retracement before resuming its upward or downward trajectory.
Why Do Retracements Occur?
Several factors contribute to the occurrence of retracements in financial markets:
- Profit-Taking: Investors who have profited from a recent price increase may choose to sell their holdings, leading to a temporary price decline.
- Market Sentiment Shifts: Changes in investor confidence or economic news can trigger a temporary reversal of the prevailing trend.
- Technical Corrections: Markets often experience corrections after prolonged periods of upward or downward movement. These corrections can manifest as retracements.
- News Events: Unexpected news events, such as earnings reports or economic data releases, can cause temporary price fluctuations.
Identifying Retracements: Tools and Techniques
Recognizing a retracement is crucial for making informed trading decisions. Several tools and techniques can help identify potential retracements:
Fibonacci Retracement Levels
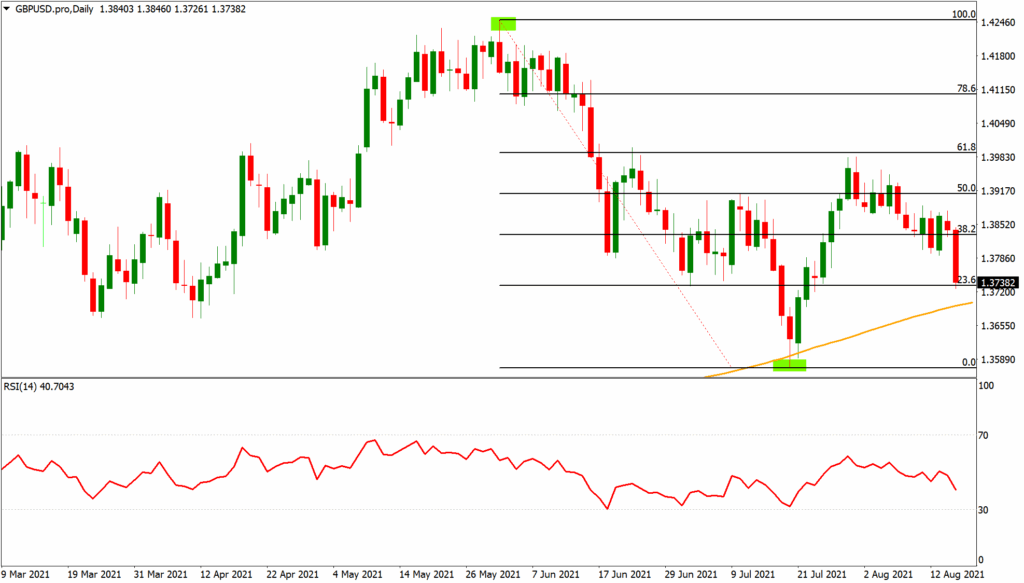
Fibonacci retracement levels are horizontal lines on a stock chart that indicate potential areas of support or resistance. These levels are based on the Fibonacci sequence, a mathematical sequence that appears frequently in nature and financial markets. Common Fibonacci retracement levels include 23.6%, 38.2%, 50%, 61.8%, and 78.6%. Traders often use these levels to identify potential entry or exit points during a retracement.
Trendlines
Trendlines are lines drawn on a chart to connect a series of highs or lows. A rising trendline connects higher lows in an uptrend, while a falling trendline connects lower highs in a downtrend. When the price breaks below a rising trendline or above a falling trendline, it can signal the start of a retracement. [See also: Understanding Trendlines in Trading]
Moving Averages
Moving averages smooth out price data by calculating the average price over a specific period. Common moving average periods include 50-day, 100-day, and 200-day. When the price crosses below a moving average in an uptrend or above a moving average in a downtrend, it can indicate a potential retracement. These tools help in grasping the retracement meaning in context.
Relative Strength Index (RSI)
The RSI is a momentum oscillator that measures the magnitude of recent price changes to evaluate overbought or oversold conditions in the price of a stock or other asset. An RSI above 70 generally indicates an overbought condition, suggesting a potential retracement downward. Conversely, an RSI below 30 suggests an oversold condition, potentially leading to a retracement upward. [See also: Guide to Using RSI Indicator]
Trading Strategies for Retracements
Once you’ve identified a potential retracement, you can employ various trading strategies to capitalize on the opportunity:
Buying the Dip
In an uptrend, a retracement can present an opportunity to buy the stock at a lower price before it resumes its upward trajectory. This strategy involves identifying key support levels, such as Fibonacci retracement levels or trendlines, and placing buy orders near these levels. This allows you to enter the market at a favorable price and potentially profit from the continuation of the uptrend. The retracement meaning in this context is a potential buying opportunity.
Selling the Rally
In a downtrend, a retracement can provide an opportunity to sell the stock at a higher price before it resumes its downward trajectory. This strategy involves identifying key resistance levels and placing sell orders near these levels. This allows you to enter the market at a favorable price and potentially profit from the continuation of the downtrend.
Using Stop-Loss Orders
Regardless of the strategy you choose, it’s crucial to use stop-loss orders to limit your potential losses. A stop-loss order is an order to automatically sell your stock if it reaches a certain price. This helps protect you from significant losses if the retracement turns into a full-blown trend reversal.
Retracement vs. Reversal: Understanding the Difference
It’s important to distinguish between a retracement and a reversal. A retracement is a temporary price movement against the prevailing trend, while a reversal is a change in the overall direction of the trend. Identifying the difference can be challenging, but several factors can help:
- Duration: Retracements are typically shorter in duration than reversals.
- Magnitude: Retracements usually retrace a smaller percentage of the previous price movement than reversals.
- Volume: Volume often decreases during a retracement and increases during a reversal.
- Confirmation: Look for confirmation from other technical indicators, such as moving averages or trendlines, to determine whether a price movement is a retracement or a reversal.
Understanding the retracement meaning and how it differs from a reversal is key to avoiding costly mistakes. A misidentified retracement can lead to premature exits or entries, impacting profitability.
The Significance of Understanding Retracements
Understanding retracements is crucial for several reasons:
- Improved Entry and Exit Points: Identifying retracements can help you enter and exit trades at more favorable prices.
- Risk Management: Understanding retracements allows you to set more effective stop-loss orders and manage your risk more effectively.
- Trend Confirmation: Retracements can provide confirmation of the prevailing trend.
- Profit Opportunities: By understanding retracements, you can identify potential profit opportunities in both uptrends and downtrends.
Real-World Examples of Retracements
Let’s consider a few hypothetical examples to illustrate the retracement meaning in practice:
Example 1: A stock is in a strong uptrend, rising from $50 to $75. It then experiences a retracement back to $65 before resuming its upward trajectory. A trader who recognizes this retracement could buy the stock at $65 and potentially profit as the price continues to rise.
Example 2: A stock is in a downtrend, falling from $100 to $75. It then experiences a retracement back to $85 before resuming its downward trajectory. A trader who recognizes this retracement could sell the stock at $85 and potentially profit as the price continues to fall.
The Psychology Behind Retracements
Understanding the psychology behind retracements can provide valuable insights into market behavior. Retracements often reflect a period of uncertainty or consolidation as investors re-evaluate their positions. Fear and greed can also play a role, with investors taking profits or becoming hesitant to buy or sell at certain price levels. Recognizing these psychological factors can help you anticipate potential retracements and make more informed trading decisions.
Advanced Retracement Techniques
For more advanced traders, combining retracement analysis with other technical indicators can enhance accuracy. For example, using volume analysis to confirm a retracement can provide a stronger signal. Similarly, combining Fibonacci retracement levels with Elliott Wave theory can offer a more comprehensive view of market cycles.
Common Mistakes to Avoid When Trading Retracements
Trading retracements can be profitable, but it’s essential to avoid common mistakes:
- Failing to Identify the Trend: Always identify the prevailing trend before attempting to trade a retracement.
- Ignoring Risk Management: Use stop-loss orders to limit your potential losses.
- Chasing the Price: Avoid chasing the price during a retracement. Wait for confirmation before entering a trade.
- Ignoring Fundamental Analysis: Consider fundamental factors, such as earnings reports and economic data, in addition to technical analysis.
Conclusion: Mastering the Art of Retracement Trading
Understanding the retracement meaning and how to identify and trade them is a valuable skill for any trader or investor. By using the tools and techniques discussed in this article, you can improve your entry and exit points, manage your risk more effectively, and potentially increase your profits. Remember to always practice proper risk management and continue to refine your trading strategy based on your experiences. Mastering the art of retracement trading can significantly enhance your success in the financial markets. The key is to consistently analyze market behavior and adapt your strategies accordingly. Understanding the nuances of retracement meaning will undoubtedly aid in this process.
