Retracement Meaning: Understanding Market Pullbacks for Smarter Investing
In the dynamic world of financial markets, understanding the ebb and flow of prices is crucial for making informed investment decisions. One key concept that every trader and investor should grasp is the retracement meaning. A retracement is a temporary reversal in the price of an asset within a larger trend. It’s essentially a pullback or a dip before the price potentially continues in its original direction. Understanding the retracement meaning helps investors identify potential entry and exit points, manage risk, and ultimately, improve their trading strategies.
This article delves into the retracement meaning, exploring its definition, identification methods, importance in trading, and common tools used to analyze them. We’ll also discuss the difference between retracements and reversals, and offer practical examples to illustrate how to use retracements effectively.
What is a Retracement? A Detailed Explanation
A retracement, in the context of financial markets, refers to a temporary price movement against the prevailing trend. It’s a short-term correction that doesn’t signal a change in the overall direction of the market. Think of it like this: if a stock is generally trending upwards, a retracement would be a brief period where the price dips downwards before potentially resuming its upward trajectory. Conversely, in a downtrend, a retracement would be a temporary price increase before the price potentially continues its decline.
Understanding the retracement meaning is vital because it allows traders to distinguish between short-term fluctuations and long-term trend changes. This distinction is essential for making sound investment decisions and avoiding costly mistakes.
Identifying Retracements: Key Indicators and Techniques
Identifying retracements requires a combination of technical analysis tools and a keen understanding of market dynamics. Here are some key indicators and techniques that can help:
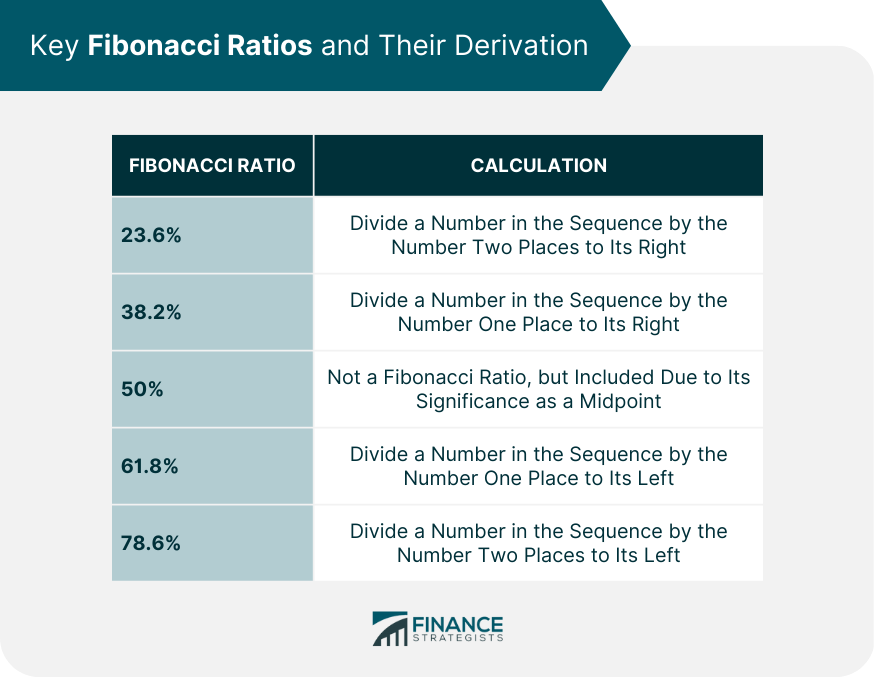
- Fibonacci Retracement Levels: These are horizontal lines that indicate potential support and resistance levels where the price might stall or reverse. They are based on the Fibonacci sequence and are widely used by traders to identify potential retracement levels. Common Fibonacci retracement levels include 23.6%, 38.2%, 50%, 61.8%, and 78.6%.
- Moving Averages: Moving averages smooth out price data over a specific period, helping to identify the overall trend. When the price pulls back to a moving average line, it can act as a support or resistance level, indicating a potential retracement.
- Trendlines: Trendlines are lines drawn on a chart connecting a series of highs or lows. When the price bounces off a trendline, it can signal a continuation of the existing trend after a retracement.
- Volume Analysis: Analyzing trading volume can provide clues about the strength of a trend and the likelihood of a retracement. For example, if a price increase is accompanied by low volume, it might suggest a weak trend and a higher probability of a retracement.
- Chart Patterns: Certain chart patterns, such as flags and pennants, often indicate retracements within a larger trend. Recognizing these patterns can help traders anticipate potential pullbacks and plan their trades accordingly.
The Importance of Retracements in Trading and Investing
Understanding the retracement meaning is crucial for successful trading and investing for several reasons:
- Identifying Entry Points: Retracements offer opportunities to enter a trade in the direction of the prevailing trend at a more favorable price. By waiting for a pullback, traders can potentially buy low in an uptrend or sell high in a downtrend.
- Managing Risk: Recognizing potential retracement levels allows traders to set stop-loss orders more effectively. By placing stop-loss orders below support levels in an uptrend or above resistance levels in a downtrend, traders can limit their potential losses.
- Profit Taking: Retracements can also be used to identify potential profit-taking levels. Traders may choose to take profits when the price reaches a significant retracement level, anticipating a potential reversal.
- Trend Confirmation: Observing how the price reacts to retracement levels can help confirm the strength of the underlying trend. If the price consistently bounces off support levels in an uptrend or resistance levels in a downtrend, it reinforces the validity of the trend.
Common Tools for Analyzing Retracements
Several tools are commonly used to analyze retracements and identify potential trading opportunities:
- Fibonacci Retracement Tool: This tool automatically plots Fibonacci retracement levels on a chart, allowing traders to quickly identify potential support and resistance areas.
- Moving Average Convergence Divergence (MACD): The MACD is a momentum indicator that can help identify potential retracements and reversals. Crossovers and divergences in the MACD can signal changes in price momentum.
- Relative Strength Index (RSI): The RSI is an oscillator that measures the magnitude of recent price changes to evaluate overbought or oversold conditions. Overbought or oversold readings can indicate a potential retracement.
- Volume Indicators: Volume indicators, such as the On Balance Volume (OBV), can help confirm the strength of a trend and identify potential retracements.
Retracement vs. Reversal: Understanding the Difference
It’s important to distinguish between a retracement and a reversal. While both involve price movements against the prevailing trend, they have different implications.
A retracement is a temporary pullback that doesn’t change the overall direction of the trend. The price is expected to resume its original trajectory after the retracement. On the other hand, a reversal signifies a change in the trend. The price is expected to move in the opposite direction of the previous trend.
Distinguishing between a retracement and a reversal can be challenging, but some key indicators can help:
- Duration: Retracements are typically shorter in duration than reversals.
- Magnitude: Retracements usually involve smaller price movements than reversals.
- Volume: Reversals are often accompanied by higher trading volume than retracements.
- Confirmation: Reversals are often confirmed by other technical indicators and chart patterns.
Practical Examples of Retracement in Action
Let’s look at a couple of examples to illustrate how retracements work in practice:
Example 1: Uptrend
Imagine a stock is trending upwards. The price makes a series of higher highs and higher lows. During one period, the price pulls back, retracing a portion of its previous upward movement. This pullback is a retracement. A trader might use Fibonacci retracement levels to identify potential support levels where the price might bounce back up. If the price bounces off a 38.2% Fibonacci retracement level, the trader might enter a long position, anticipating a continuation of the uptrend.
Example 2: Downtrend
Now, consider a stock that is trending downwards. The price makes a series of lower highs and lower lows. During one period, the price rallies upwards, retracing a portion of its previous downward movement. This rally is a retracement. A trader might use moving averages to identify potential resistance levels where the price might reverse back down. If the price stalls at a 50-day moving average, the trader might enter a short position, anticipating a continuation of the downtrend.
Tips for Trading Retracements Effectively
Here are some tips for trading retracements effectively:
- Use a Combination of Tools: Don’t rely on just one indicator. Use a combination of technical analysis tools to confirm potential retracement levels.
- Be Patient: Wait for confirmation before entering a trade. Don’t jump the gun and enter a position before the price shows signs of reversing at a retracement level.
- Manage Risk: Always set stop-loss orders to limit your potential losses. Place stop-loss orders below support levels in an uptrend or above resistance levels in a downtrend.
- Consider Market Context: Take into account the overall market context when trading retracements. Pay attention to economic news, earnings reports, and other factors that could affect the price of the asset.
- Practice: Practice trading retracements in a demo account before risking real money. This will allow you to refine your strategy and gain confidence in your ability to identify and trade retracements effectively.
Conclusion: Mastering Retracements for Investment Success
Understanding the retracement meaning is a valuable skill for any trader or investor. By learning to identify and analyze retracements, you can improve your entry and exit points, manage risk more effectively, and ultimately, increase your chances of success in the financial markets. Remember to use a combination of technical analysis tools, be patient, manage risk, and practice your strategy before risking real money. [See also: Trend Analysis Techniques] [See also: Risk Management Strategies] [See also: Technical Indicators Explained] With dedication and practice, you can master the art of trading retracements and achieve your investment goals.
