The Definitive Technical Analysis Textbook: Mastering Market Dynamics
Technical analysis is a crucial skill for anyone involved in financial markets, from day traders to long-term investors. Understanding price charts, patterns, and indicators can provide a significant edge in navigating market volatility and making informed decisions. Choosing the right technical analysis textbook is the first step toward mastering these skills. This article explores the essential elements of a comprehensive technical analysis textbook, highlighting key concepts, methodologies, and resources that will empower you to become a proficient technical analyst.
What is Technical Analysis?
Technical analysis is the practice of evaluating investments by analyzing statistics generated by market activity, such as past prices and volume. Technical analysts do not attempt to measure a security’s intrinsic value, but instead use charts and other tools to identify patterns that can suggest future activity. Unlike fundamental analysis, which focuses on a company’s financials, technical analysis is purely concerned with market data.
The core assumptions of technical analysis include:
- Market action discounts everything: All known information is reflected in the price.
- Prices move in trends: Prices tend to move in trends, which can be upward, downward, or sideways.
- History repeats itself: Chart patterns and market cycles tend to repeat over time.
Key Components of a Comprehensive Technical Analysis Textbook
A high-quality technical analysis textbook should cover a range of topics, from basic concepts to advanced strategies. Here are some essential elements to look for:
Introduction to Charting
Charting is the foundation of technical analysis. A good technical analysis textbook should introduce different types of charts, including:
- Line charts: These are the simplest type of chart, connecting closing prices over a period.
- Bar charts: These charts show the opening, high, low, and closing prices for each period.
- Candlestick charts: Similar to bar charts, candlestick charts provide a visual representation of price movements, with different colors indicating whether the closing price was higher or lower than the opening price.
- Point and Figure charts: These charts filter out minor price movements and focus on significant trends.
The textbook should also explain how to identify support and resistance levels, which are key areas where prices tend to find buying or selling pressure.
Understanding Technical Indicators
Technical indicators are mathematical calculations based on price and volume data. They can provide insights into market trends, momentum, volatility, and overbought/oversold conditions. A technical analysis textbook should cover a wide range of indicators, including:
- Moving Averages: These smooth out price data to identify trends. Simple Moving Averages (SMA) and Exponential Moving Averages (EMA) are commonly used.
- Relative Strength Index (RSI): This measures the magnitude of recent price changes to evaluate overbought or oversold conditions.
- Moving Average Convergence Divergence (MACD): This indicator shows the relationship between two moving averages of prices.
- Stochastic Oscillator: This compares a security’s closing price to its price range over a given period.
- Bollinger Bands: These measure volatility by plotting bands around a moving average.
- Volume Indicators: Indicators like On Balance Volume (OBV) and Accumulation/Distribution Line analyze volume to confirm price trends.
The textbook should explain the formulas behind these indicators, how to interpret their signals, and their limitations.
Chart Patterns
Chart patterns are recognizable formations on price charts that can indicate potential future price movements. A technical analysis textbook should cover both reversal and continuation patterns.
Reversal patterns signal a potential change in the current trend:
- Head and Shoulders: This pattern indicates a potential top.
- Inverse Head and Shoulders: This pattern indicates a potential bottom.
- Double Top and Double Bottom: These patterns suggest a reversal after a period of consolidation.
Continuation patterns suggest that the current trend is likely to continue:
- Triangles: These patterns can be symmetrical, ascending, or descending.
- Flags and Pennants: These are short-term continuation patterns.
The textbook should provide clear examples of these patterns and explain how to trade them effectively.
Elliott Wave Theory
The Elliott Wave Theory is a complex system that attempts to identify recurring patterns in market prices. It is based on the idea that market prices move in specific patterns called waves, which are driven by investor psychology. A comprehensive technical analysis textbook should provide an overview of the Elliott Wave Theory, including:
- Impulse Waves: These move in the direction of the main trend and consist of five sub-waves.
- Corrective Waves: These move against the main trend and consist of three sub-waves.
- Fibonacci Ratios: These are used to identify potential support and resistance levels within Elliott Wave patterns.
While the Elliott Wave Theory can be challenging to master, it can provide valuable insights into market dynamics.
Fibonacci Analysis
Fibonacci analysis uses Fibonacci ratios, derived from the Fibonacci sequence, to identify potential support and resistance levels, as well as price targets. A technical analysis textbook should cover the following Fibonacci tools:
- Fibonacci Retracements: These are used to identify potential support and resistance levels based on Fibonacci ratios (23.6%, 38.2%, 50%, 61.8%, and 78.6%).
- Fibonacci Extensions: These are used to identify potential price targets based on Fibonacci ratios.
- Fibonacci Time Zones: These are used to project potential turning points in time.
Fibonacci analysis can be a powerful tool when used in conjunction with other technical analysis techniques.
Risk Management
Risk management is a critical aspect of trading and investing. A good technical analysis textbook should cover risk management techniques, including:
- Stop-Loss Orders: These are used to limit potential losses on a trade.
- Position Sizing: This involves determining the appropriate amount of capital to allocate to each trade based on risk tolerance and account size.
- Diversification: This involves spreading investments across different asset classes to reduce overall portfolio risk.
Understanding and implementing effective risk management strategies is essential for long-term success in the market. [See also: Risk Management Strategies for Traders]
Choosing the Right Technical Analysis Textbook
With so many technical analysis textbooks available, it can be challenging to choose the right one. Here are some factors to consider:
- Level of Expertise: Some textbooks are designed for beginners, while others are geared toward more experienced traders. Choose a textbook that matches your current level of knowledge and experience.
- Coverage: Make sure the textbook covers the topics that are most relevant to your trading style and investment goals.
- Author’s Credentials: Look for textbooks written by experienced traders or analysts with a proven track record.
- Reviews: Read reviews from other traders and investors to get an idea of the textbook’s quality and effectiveness.
- Examples and Case Studies: A good technical analysis textbook should include plenty of real-world examples and case studies to illustrate key concepts.
Recommended Technical Analysis Textbooks
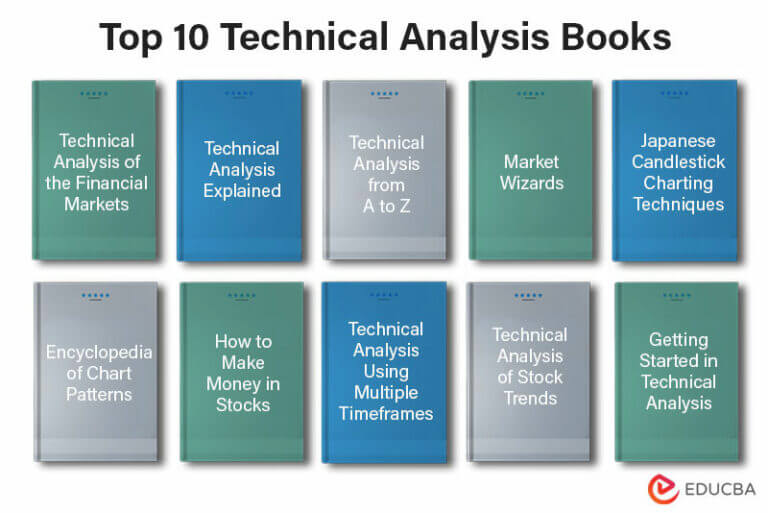
Here are a few highly regarded technical analysis textbooks:
- “Technical Analysis of the Financial Markets” by John J. Murphy: This is a classic textbook that covers a wide range of technical analysis topics.
- “Trading in the Zone” by Mark Douglas: While not strictly a technical analysis textbook, this book focuses on the psychological aspects of trading, which are crucial for success.
- “Japanese Candlestick Charting Techniques” by Steve Nison: This book provides a comprehensive guide to candlestick charting techniques.
- “How to Make Money in Stocks” by William J. O’Neil: This book outlines the CAN SLIM investment strategy, which incorporates technical analysis.
Online Resources for Technical Analysis
In addition to technical analysis textbooks, there are many online resources available to help you learn and practice technical analysis. These include:
- TradingView: This is a popular charting platform that offers a wide range of technical indicators and tools.
- StockCharts.com: This website provides educational articles, charting tools, and market analysis.
- Investopedia: This website offers a comprehensive glossary of financial terms and concepts, including technical analysis.
The Importance of Practice and Experience
Reading a technical analysis textbook is just the first step. To truly master technical analysis, you need to practice and gain experience. This can involve:
- Paper Trading: This involves simulating trades without risking real money.
- Backtesting: This involves testing your trading strategies on historical data.
- Live Trading: Once you are comfortable with your skills, you can start trading with real money, but start with small positions and gradually increase your risk as you gain experience.
Remember that technical analysis is not a perfect science, and no strategy is guaranteed to be profitable. However, with dedication and practice, you can develop the skills to make informed trading decisions and improve your overall performance.
Conclusion
A comprehensive technical analysis textbook is an invaluable resource for anyone looking to master the art of market analysis. By understanding the key concepts, methodologies, and tools covered in these textbooks, and by combining that knowledge with practice and experience, you can significantly enhance your trading and investing skills. Choose the right technical analysis textbook for your needs, and start your journey toward becoming a proficient technical analyst today. Remember to always manage your risk and continuously learn and adapt to the ever-changing market dynamics. The journey to mastering technical analysis requires patience and persistence, but the rewards can be substantial. Don’t be afraid to explore different technical analysis techniques and find what works best for you. Good luck!
