
Understanding Retracement: A Comprehensive Guide for Traders
In the dynamic world of financial markets, understanding price movements is crucial for making informed trading decisions. One such movement is the retracement, a temporary price reversal that occurs within a larger trend. This guide provides a comprehensive overview of retracement, its significance, how to identify it, and strategies for incorporating it into your trading plans. The goal is to equip traders with the knowledge to effectively navigate retracements and potentially capitalize on opportunities they present. This is especially useful for those looking to understand how to read market signals and improve their trading acumen. Learning about retracements can be a valuable skill.
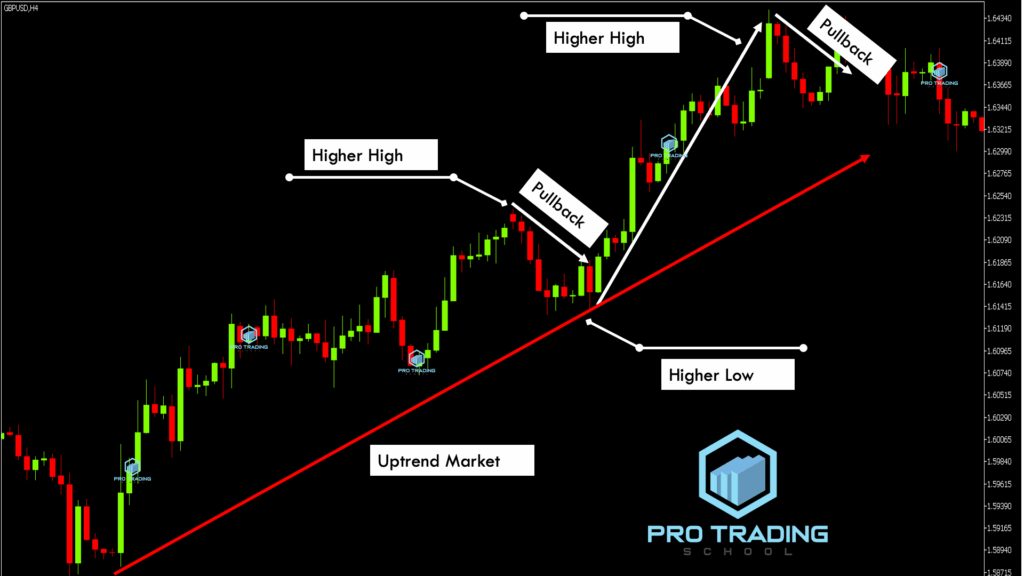
What is Retracement?
A retracement is a short-term price movement that goes against the prevailing trend. It’s a temporary pullback or correction before the price continues in its original direction. Think of it as a brief pause in the overall market narrative. Retracements are often viewed as buying opportunities in an uptrend or selling opportunities in a downtrend, assuming the underlying trend remains intact. Understanding these fluctuations is key to successful trading.
It’s important to distinguish a retracement from a reversal. A retracement is a temporary setback, while a reversal indicates a change in the overall trend. Identifying the difference between these two is critical for making informed trading decisions. A failed retracement might signal a possible reversal.
Why Retracements Occur
Retracements occur due to a variety of factors, including:
- Profit-taking: Traders who have profited from the existing trend may choose to close their positions, leading to a temporary price pullback.
- Market sentiment: Changes in market sentiment or news events can trigger short-term price corrections.
- Technical levels: Prices often encounter resistance or support at key technical levels, leading to retracements.
- Overbought or oversold conditions: When an asset becomes overbought or oversold, a retracement is more likely.
Identifying Retracements
Several tools and techniques can help traders identify potential retracements:
Fibonacci Retracement Levels
Fibonacci retracement levels are horizontal lines that indicate potential support or resistance levels where the price may pause or reverse. These levels are derived from the Fibonacci sequence and are commonly used by traders to identify possible entry and exit points. The most commonly used Fibonacci retracement levels are 23.6%, 38.2%, 50%, 61.8%, and 78.6%. Traders watch these levels for signs of price reversal or continuation. [See also: Fibonacci Trading Strategies]
To apply Fibonacci retracement levels, identify a significant swing high and swing low on a price chart. The tool will then automatically draw horizontal lines at the Fibonacci levels between those two points. Traders then look for the price to find support or resistance at these levels, potentially indicating a retracement.
Trendlines
Trendlines can also help identify retracements. A retracement often occurs when the price pulls back to test a trendline. If the price bounces off the trendline and continues in the original direction, it confirms the retracement and the continuation of the trend. Conversely, if the price breaks through the trendline, it may signal a potential trend reversal.
Moving Averages
Moving averages can act as dynamic support or resistance levels. During a retracement, the price may pull back to a moving average before resuming its original trajectory. Traders often use different moving average periods (e.g., 50-day, 200-day) to identify potential retracement levels. A retracement to a moving average can often provide a good entry point for traders.
Candlestick Patterns
Certain candlestick patterns can also indicate potential retracements. For example, a bullish engulfing pattern at a support level during an uptrend could signal a retracement is ending and the price is likely to continue higher. Similarly, a bearish engulfing pattern at a resistance level during a downtrend could indicate the end of a retracement and a continuation of the downward trend. [See also: Candlestick Pattern Recognition]
Trading Strategies Using Retracements
Once you’ve identified a potential retracement, you can use various trading strategies to capitalize on it:
Buy the Dip (Uptrend)
In an uptrend, a retracement provides an opportunity to “buy the dip.” This involves buying the asset when its price pulls back to a support level, such as a Fibonacci retracement level, trendline, or moving average. The expectation is that the price will then resume its upward trajectory. It’s important to use stop-loss orders to protect against the possibility of the retracement turning into a full-blown reversal.
Sell the Rally (Downtrend)
In a downtrend, a retracement offers an opportunity to “sell the rally.” This involves selling the asset when its price rallies to a resistance level. Similar to buying the dip, it’s crucial to use stop-loss orders to manage risk. Identifying a retracement in a downtrend is key to this strategy.
Confirmation is Key
Regardless of the strategy, it’s essential to wait for confirmation before entering a trade. This could involve waiting for a candlestick pattern to form, the price to bounce off a support or resistance level, or a technical indicator to confirm the retracement. Confirmation helps to increase the probability of a successful trade.
Risk Management
As with any trading strategy, risk management is paramount when trading retracements. Always use stop-loss orders to limit potential losses. The placement of your stop-loss order will depend on your risk tolerance and the specific trading setup. A common approach is to place the stop-loss order below the support level in an uptrend or above the resistance level in a downtrend. Proper risk management is essential when dealing with retracements.
Furthermore, consider your position size. Avoid risking too much capital on a single trade. A general guideline is to risk no more than 1-2% of your trading capital on any one trade. This helps to protect your capital and allows you to weather potential losing streaks. The psychology of trading retracements also requires a cool head.
Retracement vs. Reversal
It’s crucial to differentiate between a retracement and a reversal. A retracement is a temporary pullback within an existing trend, while a reversal indicates a change in the direction of the trend. Confusing the two can lead to costly trading errors. A deep retracement could potentially signal the start of a reversal.
Here are some key differences to consider:
- Duration: Retracements are typically shorter in duration than reversals.
- Magnitude: Retracements usually involve a smaller price movement than reversals.
- Trend Confirmation: Retracements are often followed by a continuation of the original trend, while reversals mark the beginning of a new trend.
- Volume: A reversal is often accompanied by higher volume than a retracement.
Tools for Analyzing Retracements
Several technical analysis tools can aid in identifying and analyzing retracements:
- Fibonacci Retracement Tool: As mentioned earlier, this tool helps identify potential support and resistance levels.
- Moving Averages: These can act as dynamic support and resistance levels.
- Relative Strength Index (RSI): This indicator can help identify overbought or oversold conditions, which may precede a retracement.
- MACD (Moving Average Convergence Divergence): This indicator can help identify changes in momentum, which may signal the end of a retracement.
Conclusion
Understanding retracement is a valuable skill for any trader. By learning to identify potential retracements and using appropriate trading strategies, you can potentially improve your trading performance. Remember to always use risk management techniques, such as stop-loss orders, and to differentiate between retracements and reversals. With practice and patience, you can effectively incorporate retracement trading into your overall trading plan. Recognizing a retracement can be a powerful tool in your arsenal. Happy trading!
